I will do a separate thread about this to avoid going off topic here
4 Likes
Not sure if this can be easily fixed (and it is a small thing) but when you are in middle of a hot water cycle then the individual kWh values go a little crazy. Looks like this may have been a quirk of the feed I was using for the DHW flag. I have now edited the script slightly that generates the DHW flag and this seems to have fixed the anomaly.
I’m occasionally seeing similar symptoms - in case this helps with diagnosing the issue:
It’s fine when I go into the new last-24-hours-of-data Day view.
Same here.
I’ve resisted using pymelcloud so far as it didn’t appear to give anything more than I was already monitoring but I then realised it provides the status of the HP which is perfect for the new flags for DHW and space heating.
Working perfectly!
2 Likes
just implemented this yesterday, working well. Many thanks @Timbones
small issue I just noticed.
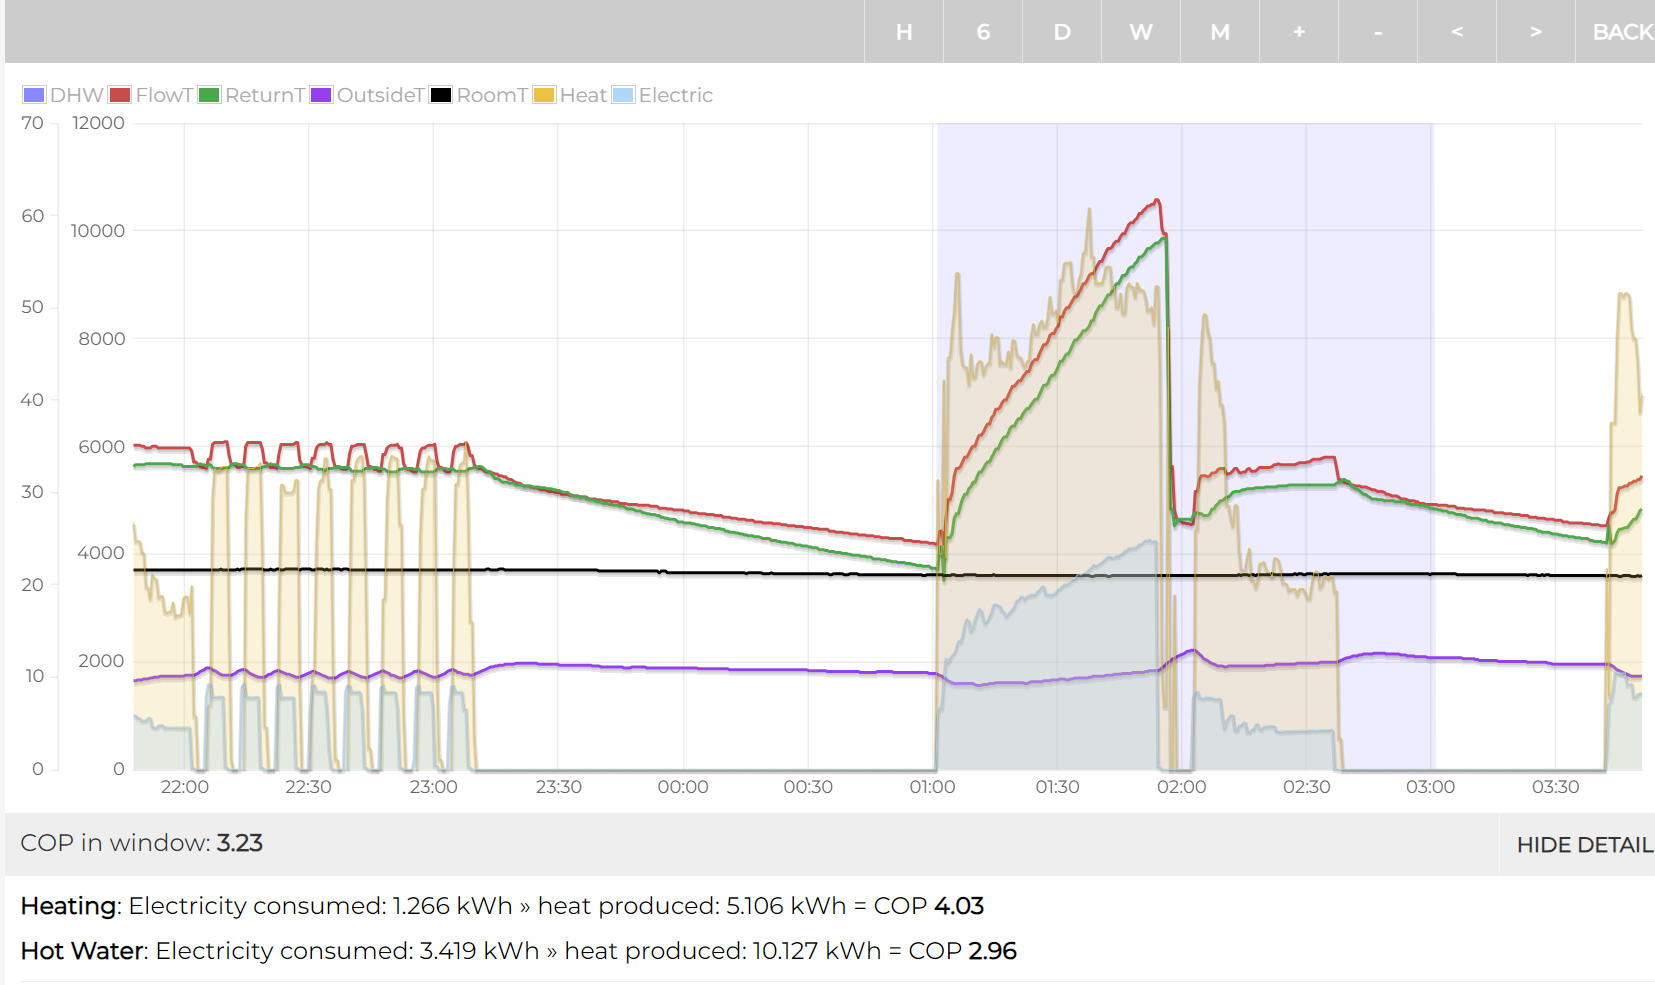
when in the “D , W or M” view, no separation of the data occured. only see that when in the H and 6 views. I did only implement this last night, so I suspect this could be because in D view, I am including time preceding the existence of the DHW flag.
I did a bit more testing and its more specifically tied to the zoom level , I think if time series includes data where the flag doesn’t exist, then it doesn’t attempt to separate the data for time series where the flag does exist. whereas intuitively I expected it to separate it where separation flag exists, if flag not exist then that part of the time go in the CH bucket. not a big deal though.
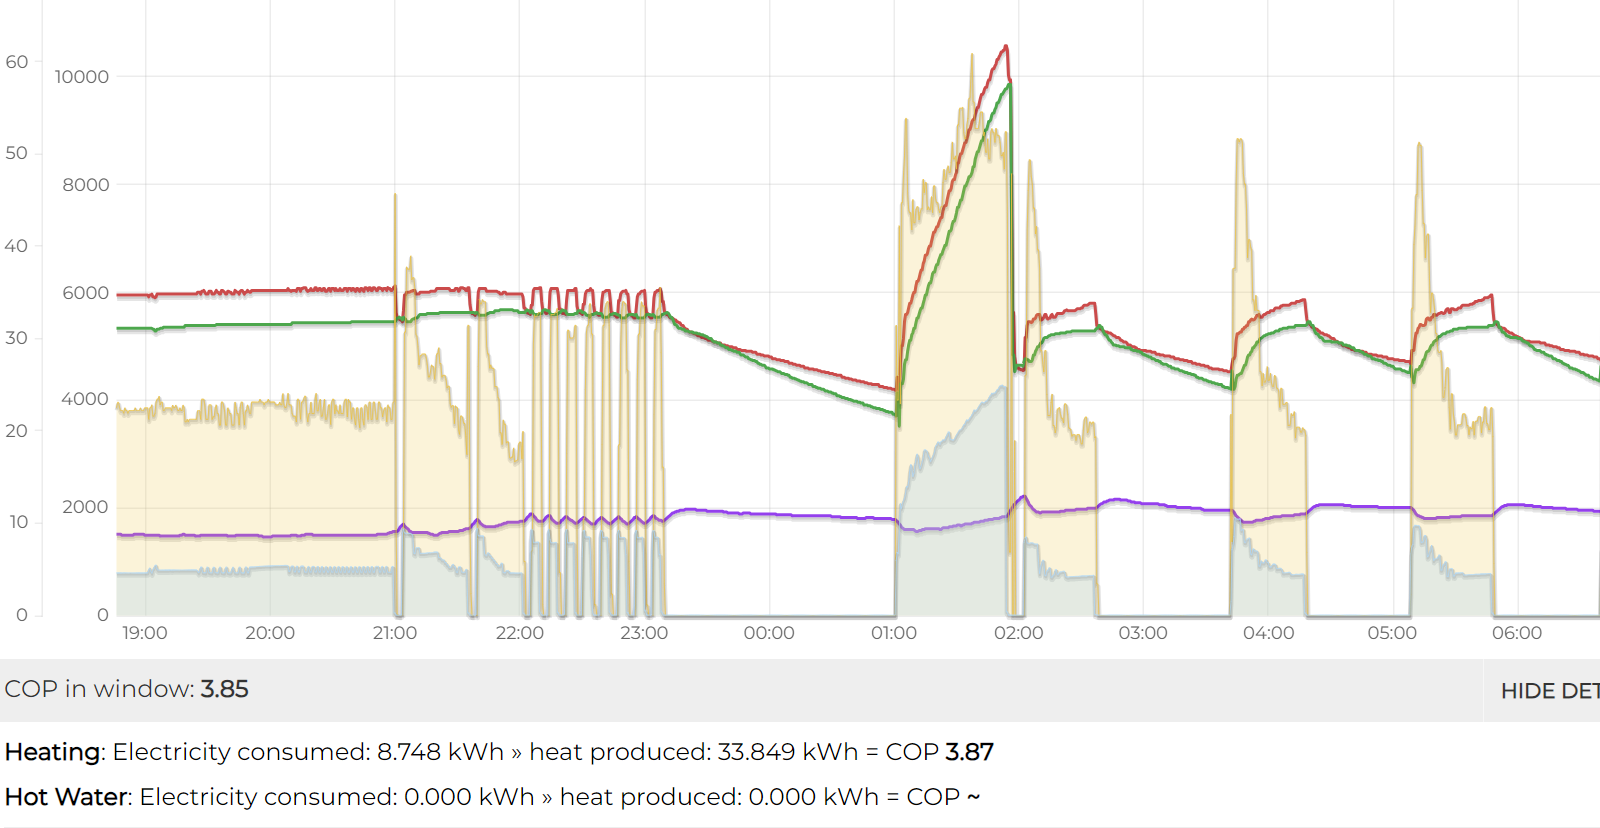
zoomed out including time prior to existence of DHW flag:
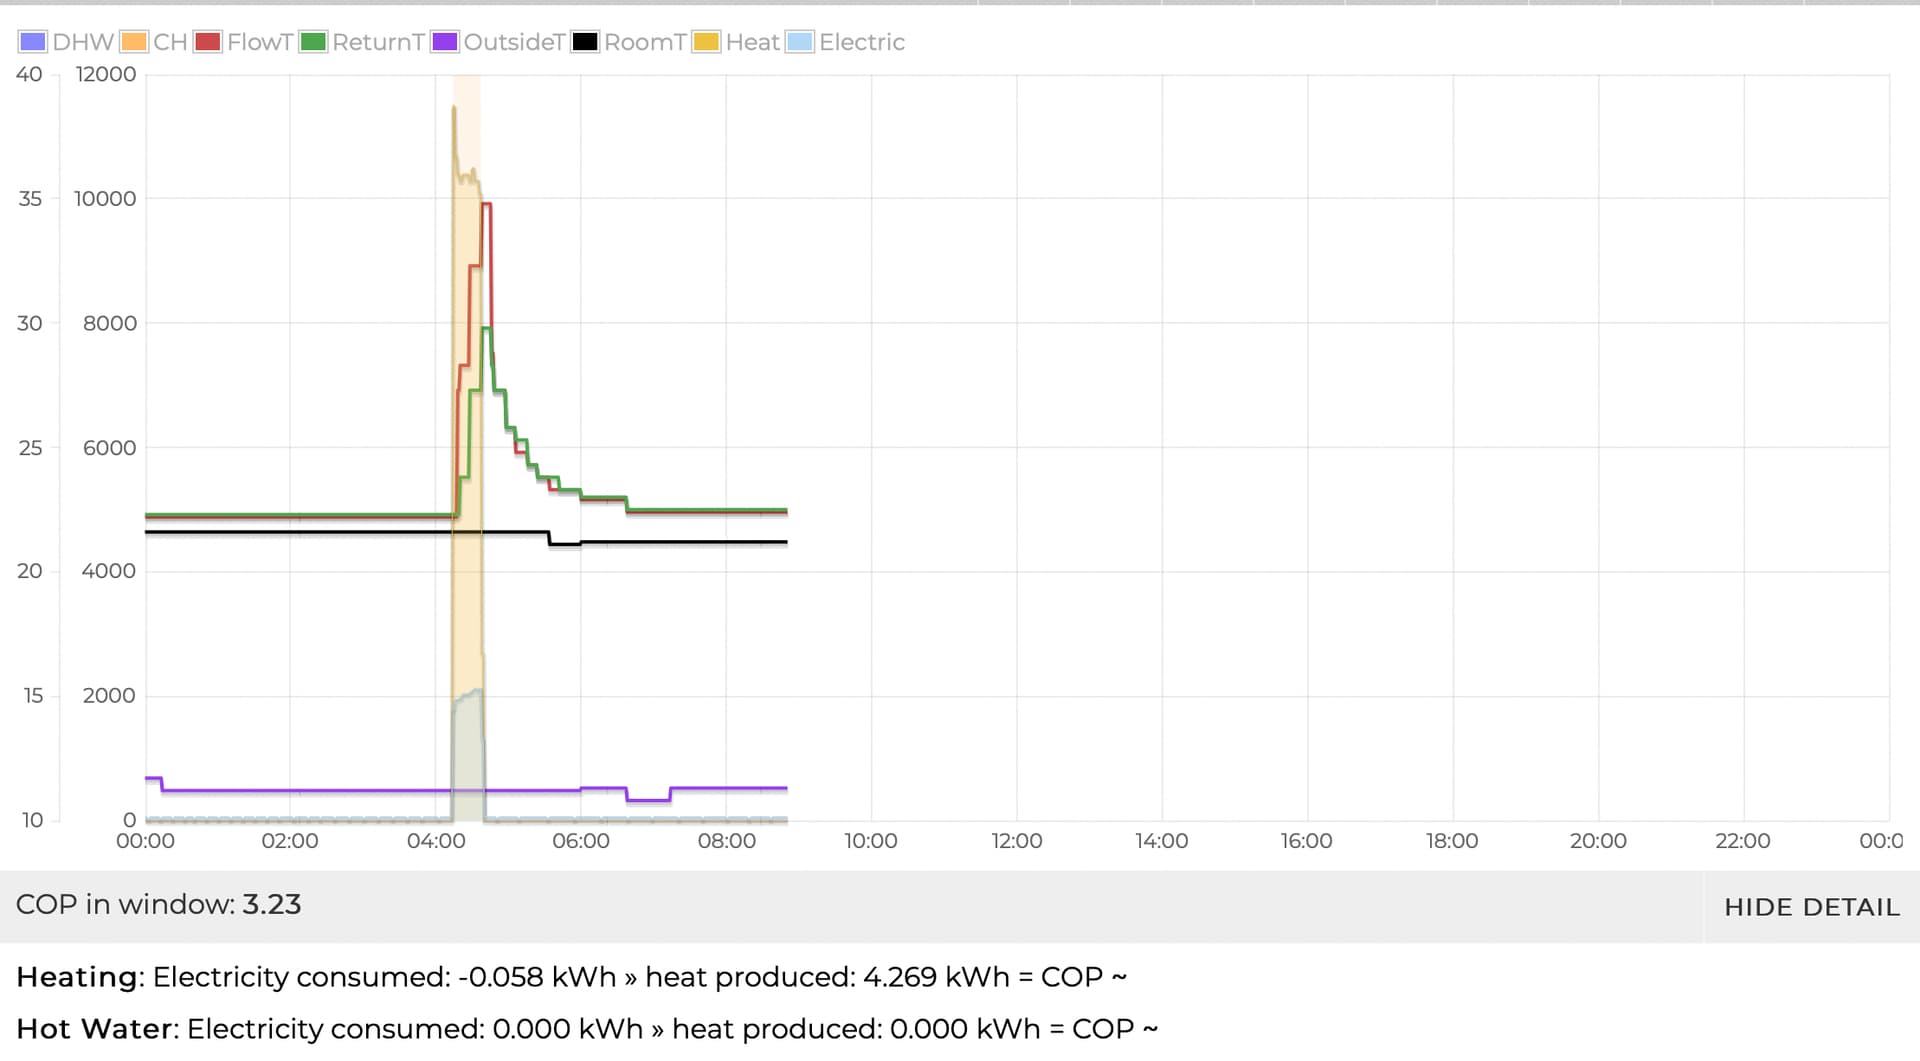
including exact same time window for DHW, but zoomed so that DHW flag exists for the whole series
(side note, I have bug in my logic for setting the flag as the second half of the highlighted period, system is actually in space heating mode, but easily fixed by me)
1 Like
I think you’re seeing some aliasing as your feed (489982) has an interval of 10s, but only has data every 30s and nulls in between. You need to update the feed more often, or recreate it with the correct interval, or use timeseries instead.
hi tim, thanks for this, I didnt even know it was a thing. My inputs are all sent to emoncms by home assistant, I think they all get sent every 30 seconds. On looking at the feeds in emoncms, they all have a feed interval of 10 seconds. when setting it up, I just configured everything with “defaults” not changing anything like this. I cannot see how to change this value?
Sadly, you cannot. I believe it’s possible by exporting the data to a file, deleting and recreating the Feed with the appropriate interval, then re-importing the data; but I don’t know the exact mechanics nor any possible pitfalls.
that sounds like far too high a probability of total data loss! what is the downside of leaving it how it is?
What you’ve experienced so far - gaps when you view the data using the graph module. You still have your data in the exported file, it’s just that I haven’t tried to do it so I don’t know exactly what you need to do.
You can always start a new Feed with a new name, and write your data to two places. Your old Feed and data will still be there, but with the NULL entries still being generated.
For the dhw feed that has only existed a short time, deleting and recreating wouldn’t mean much data is lost. The other feeds seems to be working just fine as they are, so needn’t worry about them. My Heatpump app is able to cope with nulls in those feeds but not the dhw one.
(It’s to do with requesting the feeds with averaging or not, which I’ll look into)
1 Like
that makes total sense, I only created it last night, so that is done. new DHW flag feed is every 30seconds. As you say the other feeds seem to be working fine and I don’t want to take a risk with the historic data they contain.
2 Likes
Can anyone give a quick pointer on setting this up in the way of ‘indicate DHW when heatmeter flow is above 36’ or similar. I have a low temp system so the only time I’ll get flow temps above this will be on DHW cycles. Thanks.
Simplest option is to create a Virtual Feed like this:
- Source feed: flow temperature
- Subtract 36
- Allow positive
This will produce non-zero values when the hot water is “on”, otherwise zero.
1 Like
Might be worth adding another state for defrosting.
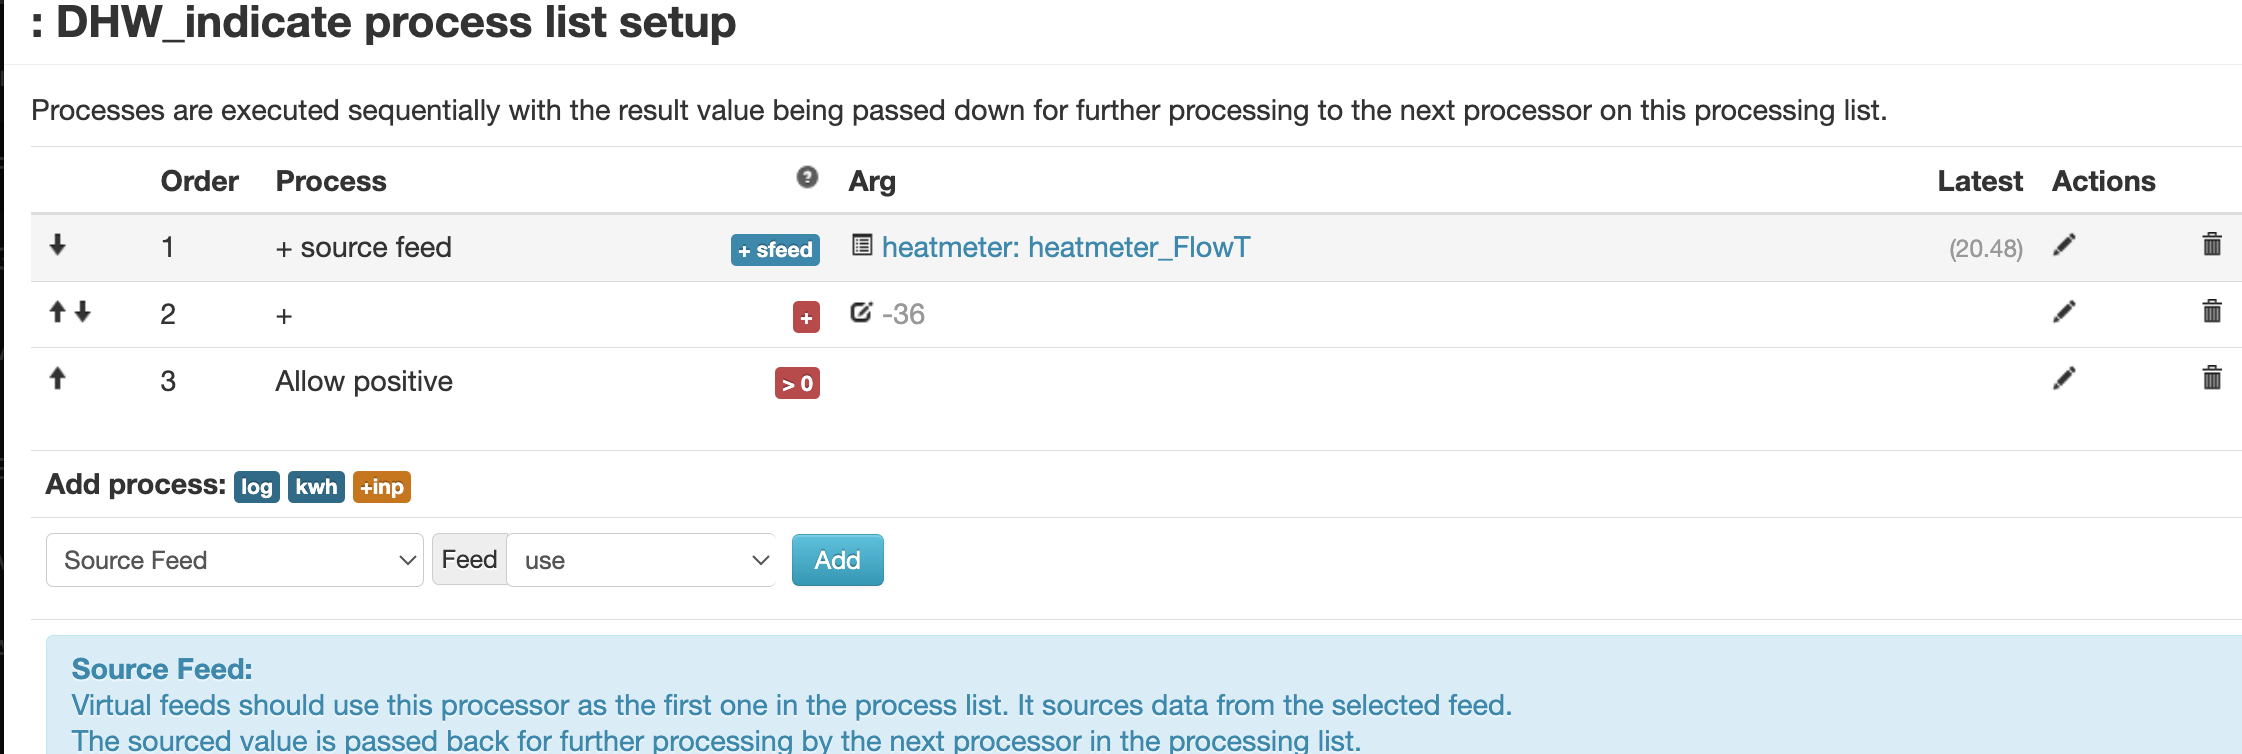
Use Source feed not + source feed.
2 Likes
Thanks Tim, that has worked a treat
3 Likes
Hi @Timbones - some more info on the minor issue Dom and I commented on previously,
In the new “DAY” (i.e. previous 24 hours) view, the summary data looks good:

The “COP in window” of 3.59 appears correct; lower than the 4.84 when in Heating mode (because I get significant passive solar gain on cold-but-sunny days and my system spends a lot of time pulling 60W in Standby with no heat production).
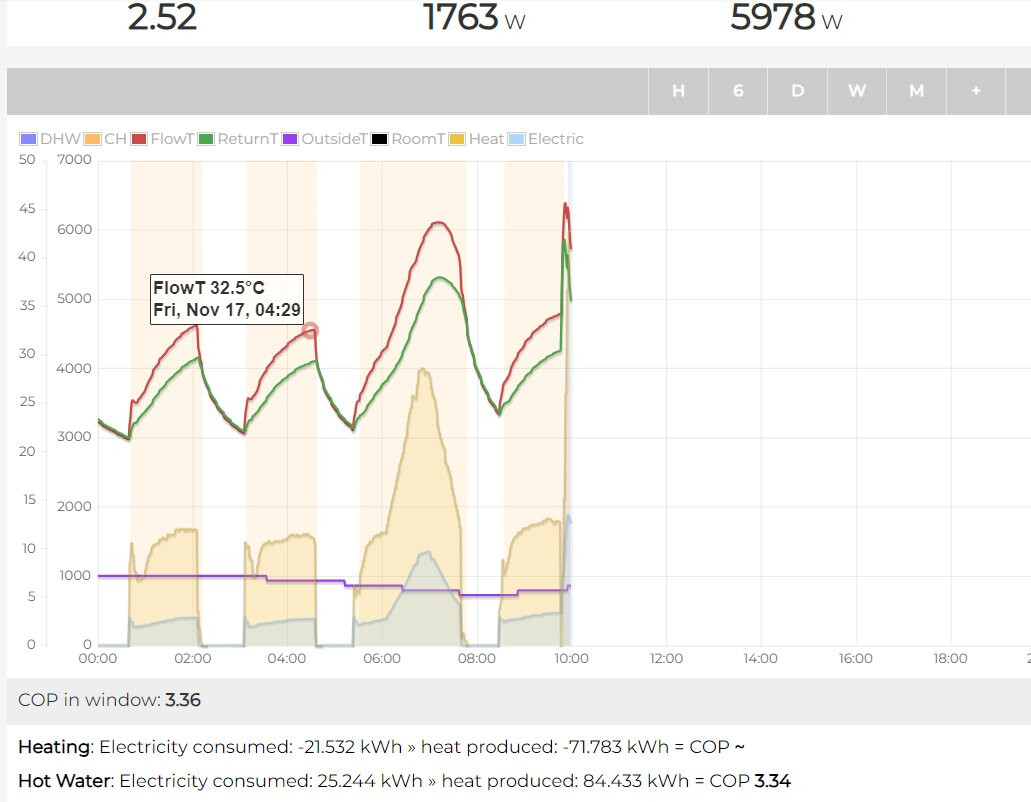
When I click on the current day on the overview histogram and go into the ‘today’ view (i.e. from 00:00, showing the data up to ‘now’) the summary COP data appears to be wrong:

The “COP in window” looks OK (less time spent in standby so expected to be a bit higher than the 3.58 on the previous image) but I don’t believe the 5.98 when in Heating mode.
Due to the long period in standby, both graphs show the same three heating cycles (no DHW because my solar PV divert covered that) so I was expecting the figures to be identical. While “heat produced” is very close (17.298 versus 17.290) the “Electricity consumed” is quite different (3.577 versus 2.893).
Does that give you any clues? It seems to be missing some of the electricity consumption when working out the COP. Is the calculation looking at the right time period?
1 Like