I wrote some Python about a year back which uses Solcast and provides the estimated output for my system for the next day.
The intention was always to integrate that with more code using the current battery levels, loads predicted tomorrow, how much the Eddi will be needed to heat the TS etc. and come up with the level I need to charge my batteries to during the Octopus Go 4 hour period (if at all).
Needless to say, that hasn’t been done yet and instead I just run it every night and then update a small webpage which sets the charge level based on what I know and past experience; really need to automate that …
The prediction for tomorrow is below. My batteries are currently at 88% and will probably drop to around 70% by 00:30 so I’ll probably set the charge level for 75%. It’ll top up to 100% pretty quickly tomorrow and then the Eddi will divert to heat the TS. When it gets sunnier, I’ll also need to factor in charging the BEV if possible from PV.
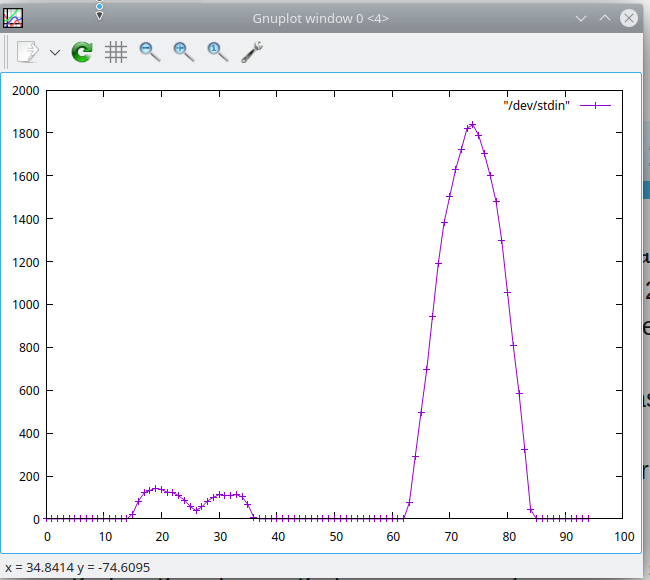
pi@emonpi:~ $ ./PVOutput/solcast_test.py
PV total = 31.166249999999994
PV 10 total = 14.616649999999998
PV 90 total = 31.8901
End: 2021-03-02
pi@emonpi:~ $
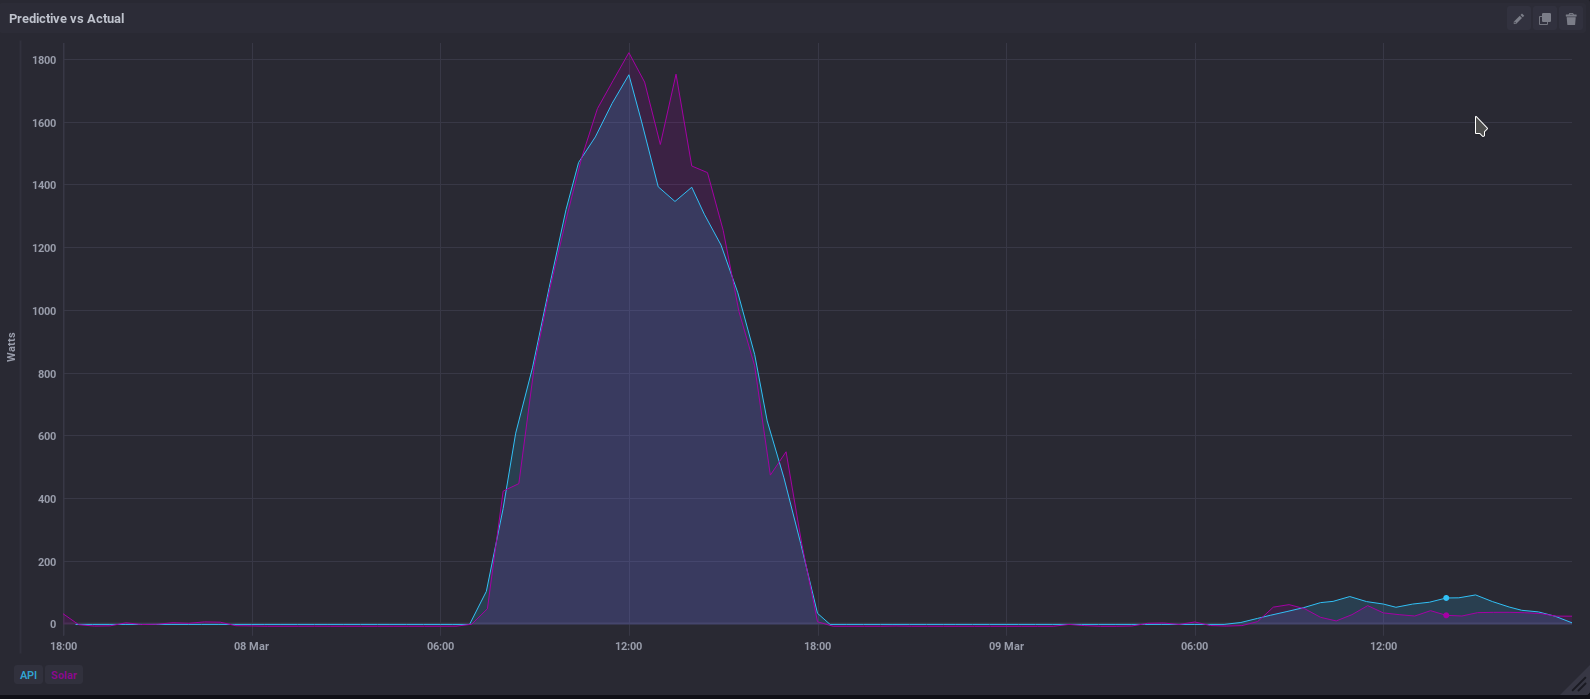
I never hooked it up to my influxdb. as you can not visualize into the future. I hooked up now and I will let run for the next couple day and let you know how it works out.
here the current predictive
it was tracking okay up to noonish today then it cleared out abit in my area but surrounding horizon all have cloud cover i just find myself in a pocket of sunshine … as it predicted reduction of cloud cover was not until 6pm today.
I was thinking about a predictive solar project of my own – so this is a great alternative. OpenWeather was a great discovery for me.
I now have yr scripts running on a Raspberry Pi running the emon image.
As well as installing Python module pysolar, I found it was necessary to sudo apt-get install lynx and the same for bc.
Unix times are not user friendly so I’ve added a line after the do line in cloudcover.sh and amended 2 later lines …
1 – Are the times period beginning times? I assume so.
2 – The results in the file solarOutput show the forecast generation as a % of the max generation that could happen in that hour. Given that I want a forecast made at around midnight of the upcoming day’s total generation in kWh – I need to be mindful that a (say) 5% forecast error at noon will be more significant in terms of kWh than a 5% forecast error at 8am (say). Am I correct in my assumption?
3 – In very broad terms, it appears that yr approach is to take the solar irradiation assuming a clear sky (this number comes from radiation.py based on pysolar) and then to use OpenWeather’s forecast to establish the amount of cloud ‘masking’. Am I correct?
4 – The free One Call API OpenWeather forecast includes a large amount of data. You have selected clouds and visibility as being relevant to cloud ‘masking’. A weather id is also published:
since openweather only offered 1 hour sampling I modified this one a bit to extrapolate to 1/2h intervals . there some added bit to adjust for my solar panel output so that it would get a closer output. as my solar panel array is in an arc shape to flatten and extend my production time … if it was a straight line then it a bit easier to calculate, the mqtt bit just to send data to influxdb
2- yes 5 % error will be bigger at noon then at the beginning of the day – for easier timing I use this timer.tar.gz (356 Bytes)
it runs on what ever number of second intervals you set it at ie ./timer.pl 3600 ./cloudcover. runs it every hour so as openweather updated their models I update my model as well you still have the 48h prediction it just hones closer you get to realtime
3- yes I am using cloud cover % and visibility ( ie fog haze smoke snow) to determine masking … I would prefer if I could find a weather api that had the 3 cloud layer - high, middle and lower clouds at hourly then you could generate a more accurate cloud cover as 100% cloud cover at high altitude reduces light to 60% but 100% cloud cover at low altitudes reduces it to 90% ( i think windy.com provides the info but I just can not get their API to work for me I will keep hunting around for one that free…)
I used epoch timestamp as pysolar output and mixing of differing timestamps you end up with error in output equal to your timezone . I also see later if you switch to human readable and for some reason when you send it to data bases that data got shifted equal to the timezone as well so it was just better to leave as epoch
okay i found one with climacell ( 1000 calls a month) it does not have low,med,high clouds but it does have base and ceiling also radiation Wm2… it seams to have more accuracy for my area for cloud cover. as open weather seamed to be about 20 miles south of me
I have not incorporated the cloud base and ceiling i will log them for a bit into my database and then try to see correlation between my lux meter and calculate the light intensity difference.
climacell also gives you 72 hours of data versus 48
That nice but many of those types of site do not cover my area and I like a challenge – but I do not find the script I used that terrible just lately trying to figure out a method to work with my solar panel array… as I never graphed it before all I used to do is take a cumulative and predict the probably daily output … . figuring out the graphing has being a bit of challenge … especially since you can only do cos in rad and not degree in the software ( or least i can not figure out how to do it in degrees)…
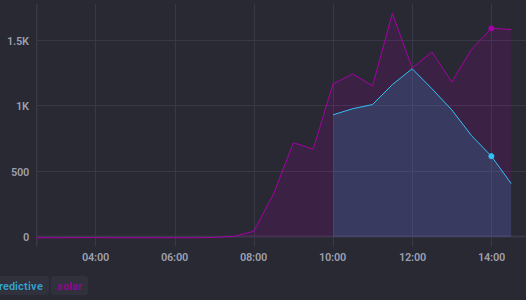
this is today’s predictive … it tracked well Until I hit hitting some sort of math bump…
but I think I got the math bump sorted. but it only works with climacell, openweather It broken at the moment ( i accidentally uploaded my key and my account hit its limit by other people using it today , so i have wait a few days to be able to work on it again)… but the panelconf should work for most panel configurations other then direct east west panel configuration as I would have to incorporate a third axis …
with this one there a script called panelconf. in there you can adjust up to 3 different panel arrays that are at different angles and adjust for albedo and inverter efficiency
#####PANEL GROUPS#########

G1A=-5        #closest to angle / 7.5degrees   -negative for east  positive for west facing -e 35degrees /7.5 = 4.666  so a setting of 5
G1w=1000 # panel wattage rated


G2A=0          #  panel facing due south or north depend what side of the equator
G2w=1000


G3A=5
G3w=1000

##### HARDWARE and other configurations

albedo=2    #albedo effect % of panel output
inverter=.90  #inverter  average efficiency
now to test the tracking and see if I worked out the math bump it just sucks I have to wait a day or two to actually see if the math bump is gone as you can not view into the future with grafana or chronograf
I suspect my final copy of my predictive solar ( unless I find another weather api that works internationally ) it graphing quite accurately. depending on the accuracy of the info it receives.
My biggest issue, I live in a remote region and the problem being relative accurate forecast info. in my case they generally using the weather radar station as my Base info for most weather API but that stations like 75 km away from me…
several ways to over come this limitation for me .
if only using one api service — take several location sample around your general location with each location being about 50km in 2-4 directions and then averaging the out come it gets pretty close prediction.
subscribe to all the api averaging them out also gives you reasonably good accuracy
or trial test each api in my case weather-api or weatherbit work the best for me and fairly accurate …
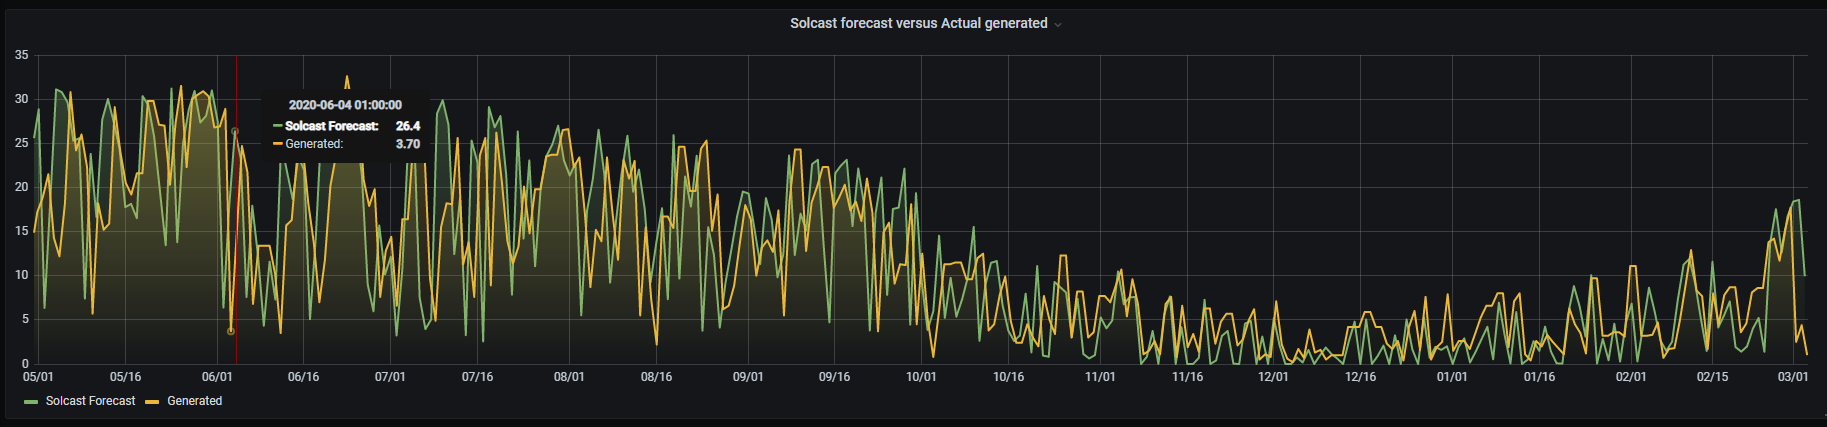
i also included a graphing script that graphs the csv’s if you want to see a quick future sample - here an example of weather api output today
and yes it was pretty spot on as it was quite overcast with a little bit of drizzle … and it looks like tomorrow will be quite sunny and clear , but only time will tell
well good luck and have fun
oh yeah my previous versions I use to upgrade every hour to get a rolling average and trending . but alot of other weather api’s do not support that as they only output single point update for forecasts starting at midnight of that day. so that became moot – so once works the best if using all the api’s
the script it proving to be very good accuracy … in graphing daily predicted production - yesterday partly cloudy and plus 7 c to today which was overcast and snowing ( 20cm) and -1c .
I cleaned up the code and so now NOT ONLY you can send 1/2 hr data point to a database to graph predicted solar output but now I added in:
The next 24 Total predictions , %of norm and hours of operation
example output ;
Clear Sky Max = 13312.16
Daily Estimate = 12838.2471
Daily Measured = 12999.89
EST.% of norm = .9644
ACT. % of norm = .97
Rounded HRs = 11.00
Depending on the API when ever you run it. it will generate the total for the next 24hrs. Some APIs only generates 36 hr period that upgrade once a day those APIs will not provide a rolling average if you sample more then once a day while other will
it was uploaded to github link above
it based on my energy monitoring system that more plug and play then others … and I can use alert function of grafana or Kapacitor to send system changes to mqtt device directly or via domotizc
if you find problem or bug let me know as I do not particularly use the CSV personally as it just send to database directly. I just added them as that is how alot of system import data
hi there I combined both the wind and solar into one package and all you need to do is edit panelconf ( your solar panel configuation) and START ( add in your APIs , location and other configurations)


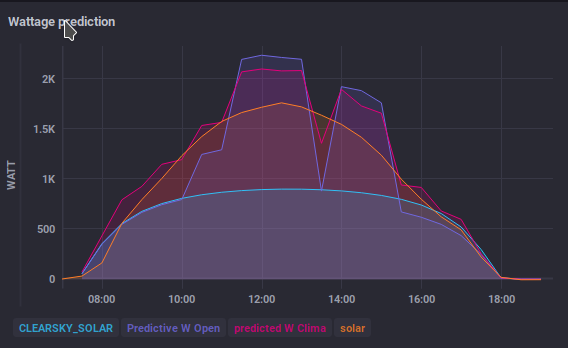 Until I hit hitting some sort of math bump…