Thanks Glyn, that is very interesting to find out and puts the COP of my system in a very different light (I had also been calculating the COP from the Samsung data as Energy Generation/Energy Consumption).
I wonder if you could give some advice on how to configure my emoncms.org inputs to get closer to the values obtained from the Samsung controller.
| Year | Month | Energy Consumption | Energy Generation | Energy Output | COP | Emoncms COP |
|---|---|---|---|---|---|---|
| 2023 | June | 71.9 | 204.8 | 276.7 | 3.85 | 2.38 |
| 2023 | May | 102.7 | 306.6 | 409.3 | 3.99 | 2.59 |
| 2023 | April | 184.1 | 560.3 | 744.4 | 4.04 | 2.71 |
| 2023 | March | 408.3 | 1215.1 | 1,623.4 | 3.98 | 2.65 |
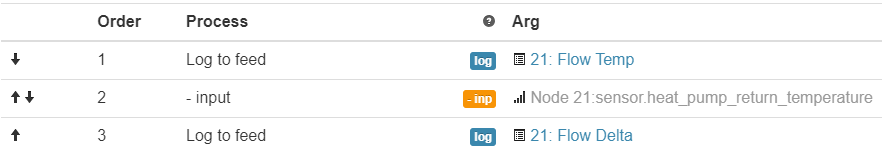
These are the calculations I have used in Emoncms:
![]()

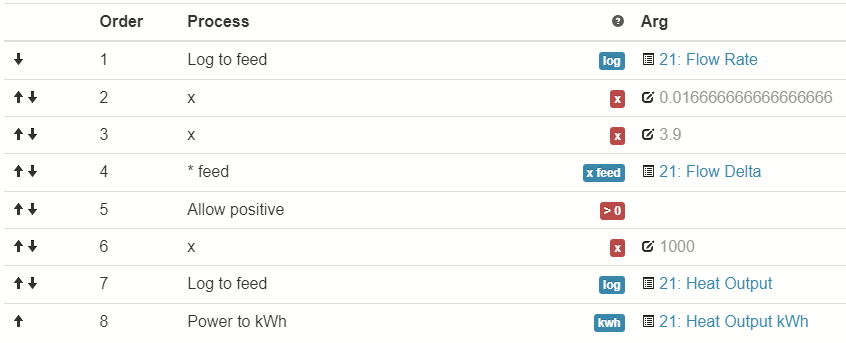
I used the formula below as the basis of my calculation:
kW (heat) = water flow (litres/sec) x 4.2 x Temperature rise (dt in Celcius)
I have used an SHC value of 3.9 as this was the closest I could find a reference for (20% Glycol) although I think my system is closer to 10% Glycol