Redundant feeds

Hello

I have just purchased and installed EmonPi, using one CT, one VT and one pulse counter. I would like to monitor the daily cost of my electricity usage at home.

I have a couple of initial questions regarding ‘feeds’:

Q1. When I was experimenting with set up I created a number of different feeds which I no longer need. From the screenshot below, I only want to keep the following 3 type feed names: ‘Energy kWh’, ‘Power total’ and ‘pulsecount’. I thought that I could delete the other feeds by selecting them and clicking on the dustbin icon. However, this only seems to get rid of the data that has been logged to that feed, not the feed itself. What should I do to permanently get rid of the feeds that I don’t want?

Q2. I created 3 type feed tags by mistake: House, emonpi and meter. Should I put the type feed names ‘Energy kWh’, ‘Power total’ and 'pulsecount under a common type feed tag (e.g. all under ‘House’)? I don’t know what difference this would make. What is the purpose of having different tags?

Thank you!

As would I. This does sound like an issue but I’m not able to test that as I’m not running the latest emoncms, perhaps someone can confirm if the’re seeing the same behaviour to determine if this is a bug or “something broke” on your setup.

What vwersion emoncms are you running? can you use the “copy server info” button on the admin page and paste the info to a post here?

Q2 - Sometimes you want/need the feeds to be grouped differently to the input nodes, eg if you had 3 emonTx’s because of a 3phase arrangement so you have an emonTx on each phase, each reading grid,solar, heating etc, you might want to see all 3 of the PV feeds together and the 3 grid feeds together etc. Or if you are monitoring more than one property, maybe you want to group al the feeds by which property they belong to.

Because the feeds are then grouped by tag in the various dropdowns in the input processing, dash editing and graphing pages, you can find it easier to manipulate and prioritise long feed lists. The tags can also be optionally hidden/displayed on graph legends which can selectively help avoid repetition in legends and/or offer a another level of identification/info in the graph legends.

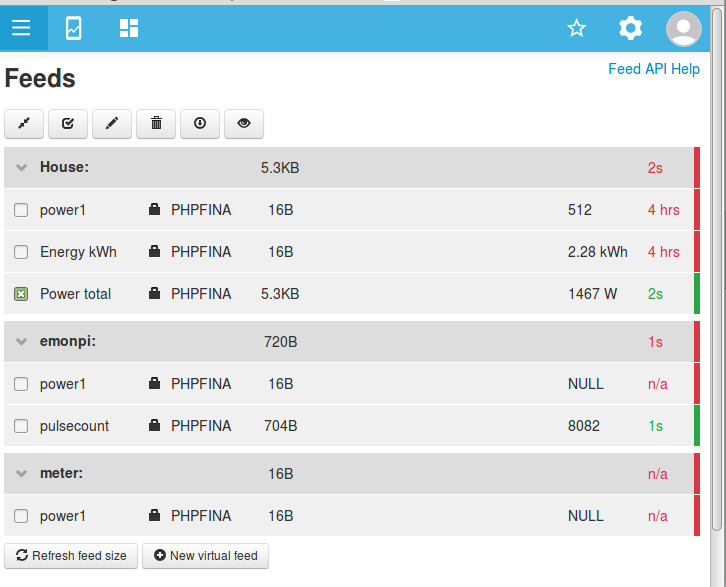
Hello Paul. Thank you for your quick reply and for your explanation on tags. I guess the type feed tags haven’t got much significance for my simple “whole house only” application.

Server Information

Services
emonhub : Active Running
emoncms_mqtt : Active Running
feedwriter : Active Running - sleep 60s 36 feed points pending write
service-runner : Active Running
emonPiLCD : Active Running
redis-server : Active Running
mosquitto : Active Running

Emoncms
Version : low-write 10.1.0
Modules : Administration | App v2.0.1 | Backup v2.1.0 | EmonHub Config v2.0.2 | Dashboard v2.0.2 | Device v2.0.0 | EventProcesses | Feed | Graph v2.0.1 | Input | Postprocess v2.1.0 | CoreProcess | Schedule | Network Setup v1.0.0 | sync | Time | User | Visualisation | WiFi v2.0.0
Git :
URL : GitHub - emoncms/emoncms: Web-app for processing, logging and visualising energy, temperature and other environmental data
Branch : * stable
Describe : v9.5.1-2047-gf53bf35b

Server
OS : Linux 4.14.71-v7+
Host : emonpi | emonpi | (192.168.1.117)
Date : 2019-06-30 08:52:52 UTC
Uptime : 08:52:52 up 18:09, 0 users, load average: 0.13, 0.09, 0.03

Memory
RAM : Used: 18.70%
Total : 976.74 MB
Used : 182.67 MB
Free : 794.07 MB
Swap : Used: 0.00%
Total : 100 MB
Used : 0 B
Free : 100 MB

Disk
/ : Used: 39.98%
Total : 3.81 GB
Used : 1.52 GB
Free : 2.11 GB
/home/pi/data : Used: 1.07%
Total : 10.32 GB
Used : 112.96 MB
Free : 9.68 GB
/boot : Used: 51.69%
Total : 42.52 MB
Used : 21.98 MB
Free : 20.54 MB

HTTP
Server : Apache/2.4.25 (Raspbian) HTTP/1.1 CGI/1.1 80

MySQL
Version : 5.5.5-10.1.23-MariaDB-9+deb9u1
Host : localhost:6379 (127.0.0.1)
Date : 2019-06-30 08:52:52 (UTC 00:00‌​)
Stats : Uptime: 151049 Threads: 2 Questions: 36697 Slow queries: 0 Opens: 28 Flush tables: 1 Open tables: 22 Queries per second avg: 0.242

Redis
Version : 3.2.6
Host : localhost:6379
Size : 76 keys (776.10K)
Uptime : 1 days

MQTT Server
Version : Mosquitto 1.4.10
Host : localhost:1883 (127.0.0.1)

PHP
Version : 7.0.30-0+deb9u1 (Zend Version 3.0.0)
Modules : apache2handler | calendar v7.0.30-0+deb9u1 | Core v7.0.30-0+deb9u1 | ctype v7.0.30-0+deb9u1 | curl v7.0.30-0+deb9u1 | date v7.0.30-0+deb9u1 | dom v20031129 | exif v7.0.30-0+deb9u1 | fileinfo v1.0.5 | filter v7.0.30-0+deb9u1 | ftp v7.0.30-0+deb9u1 | gd v7.0.30-0+deb9u1 | gettext v7.0.30-0+deb9u1 | hash v1.0 | iconv v7.0.30-0+deb9u1 | igbinary v2.0.1 | json v1.4.0 | libxml v7.0.30-0+deb9u1 | mbstring v7.0.30-0+deb9u1 | mcrypt v7.0.30-0+deb9u1 | mosquitto v0.4.0 | mysqli v7.0.30-0+deb9u1 | mysqlnd vmysqlnd 5.0.12-dev - 20150407 - $Id: b5c5906d452ec590732a93b051f3827e02749b83 $ | openssl v7.0.30-0+deb9u1 | pcre v7.0.30-0+deb9u1 | PDO v7.0.30-0+deb9u1 | pdo_mysql v7.0.30-0+deb9u1 | Phar v2.0.2 | posix v7.0.30-0+deb9u1 | readline v7.0.30-0+deb9u1 | redis v4.1.1 | Reflection v7.0.30-0+deb9u1 | session v7.0.30-0+deb9u1 | shmop v7.0.30-0+deb9u1 | SimpleXML v7.0.30-0+deb9u1 | sockets v7.0.30-0+deb9u1 | SPL v7.0.30-0+deb9u1 | standard v7.0.30-0+deb9u1 | sysvmsg v7.0.30-0+deb9u1 | sysvsem v7.0.30-0+deb9u1 | sysvshm v7.0.30-0+deb9u1 | tokenizer v7.0.30-0+deb9u1 | wddx v7.0.30-0+deb9u1 | xml v7.0.30-0+deb9u1 | xmlreader v7.0.30-0+deb9u1 | xmlwriter v7.0.30-0+deb9u1 | xsl v7.0.30-0+deb9u1 | Zend OPcache v7.0.30-0+deb9u1 | zlib v7.0.30-0+deb9u1

Pi
Model : Raspberry Pi 3 Model B+ Rev 1.3 - 1 GB (Sony UK)
SoC : Broadcom BCM2835
Serial num. : B5CAA496
Temperature : 55.31°C - 54.8°C
emonpiRelease : emonSD-30Oct18
File-system : read-write

Client Information

HTTP
Browser : Mozilla/5.0 (X11; Ubuntu; Linux x86_64; rv:63.0) Gecko/20100101 Firefox/63.0
Language : en-GB,en;q=0.5

Window
Size : 1906 x 930

Screen
Resolution : 1920 x 1080

Paul

It’s not a bug. It’s me. The window in my browser was small and I hadn’t scrolled down far enough to see the red Delete Feed Permanently button.

My apologies and thanks.

1 Like

I probably should start a new topic but, on the same newly-installed system described in my original post, I noticed some strange response in the logging around 6am today.

In the graph below, the green line is my instantaneous power and the sky blue bars are the kWh computed from that. The red bars are my pulse count divided by 1000 (to convert Wh to kWh).

The red bars and the sky blue bars should follow the same profile (although the sampling period on the pulse count is 60s and the sampling period on power measurement is 10s)

What is happening between 5.45 and 6.45? It appears that the pulses were not counted for 20 minutes and then suddenly added in a random fashion between 06:05 and 06:20. Then it happens again - the pulse counting stops until about 06:45.

I suppose it could be a meter problem? Or is it more likely to be the way the EmonPi is storing data?

At a guess, I would say for that period the pulse sensor is catching ambient light, for 2 periods within that hour, the ambient light is solid, but at the beginning, end and for a while in the middle, the light is constantly changing, perhaps there is a tree (assuming the meter is in a external box) and the branches are moving with the wind causing moments of shade? But overall the meter cab maybe in sunlight for that hour?

Drape a light tight cloth or cover over the meter and sensor tonight to see if the same occurs tomorrow. If it is ambient light, consider a little curtain or a ring of blutack etc or the readings may go to pot each time the cabinet is opened during daylight.

The meter is indoors in a cupboard but I left the cupboard doors open all night (didn’t want to attenuate the wifi signal). I’ve now closed the cupboard doors. I’ll try your blutack suggestion to overcome the ambient light issue

Thanks again. Appreciate your advice.

Hopefully, this solution for protecting the pulse counter against ambient light interference will help identify if there is a problem.