Yes, I include the monitoring of host system stats with all my deployments.
At the very least it includes CPU temperature. Many include WiFi signal, Ethernet speeds, cpu load, ram use, hdd use and /var/log use too.
Temperature alone won’t tell you much but if it’s compared to cpu load and/or ram use, or even spikes in the /var/log size it will tell you if it’s working harder or if there’s a runaway fault (increased log file sizes). Plus ambient temperature will put things in better perspective.
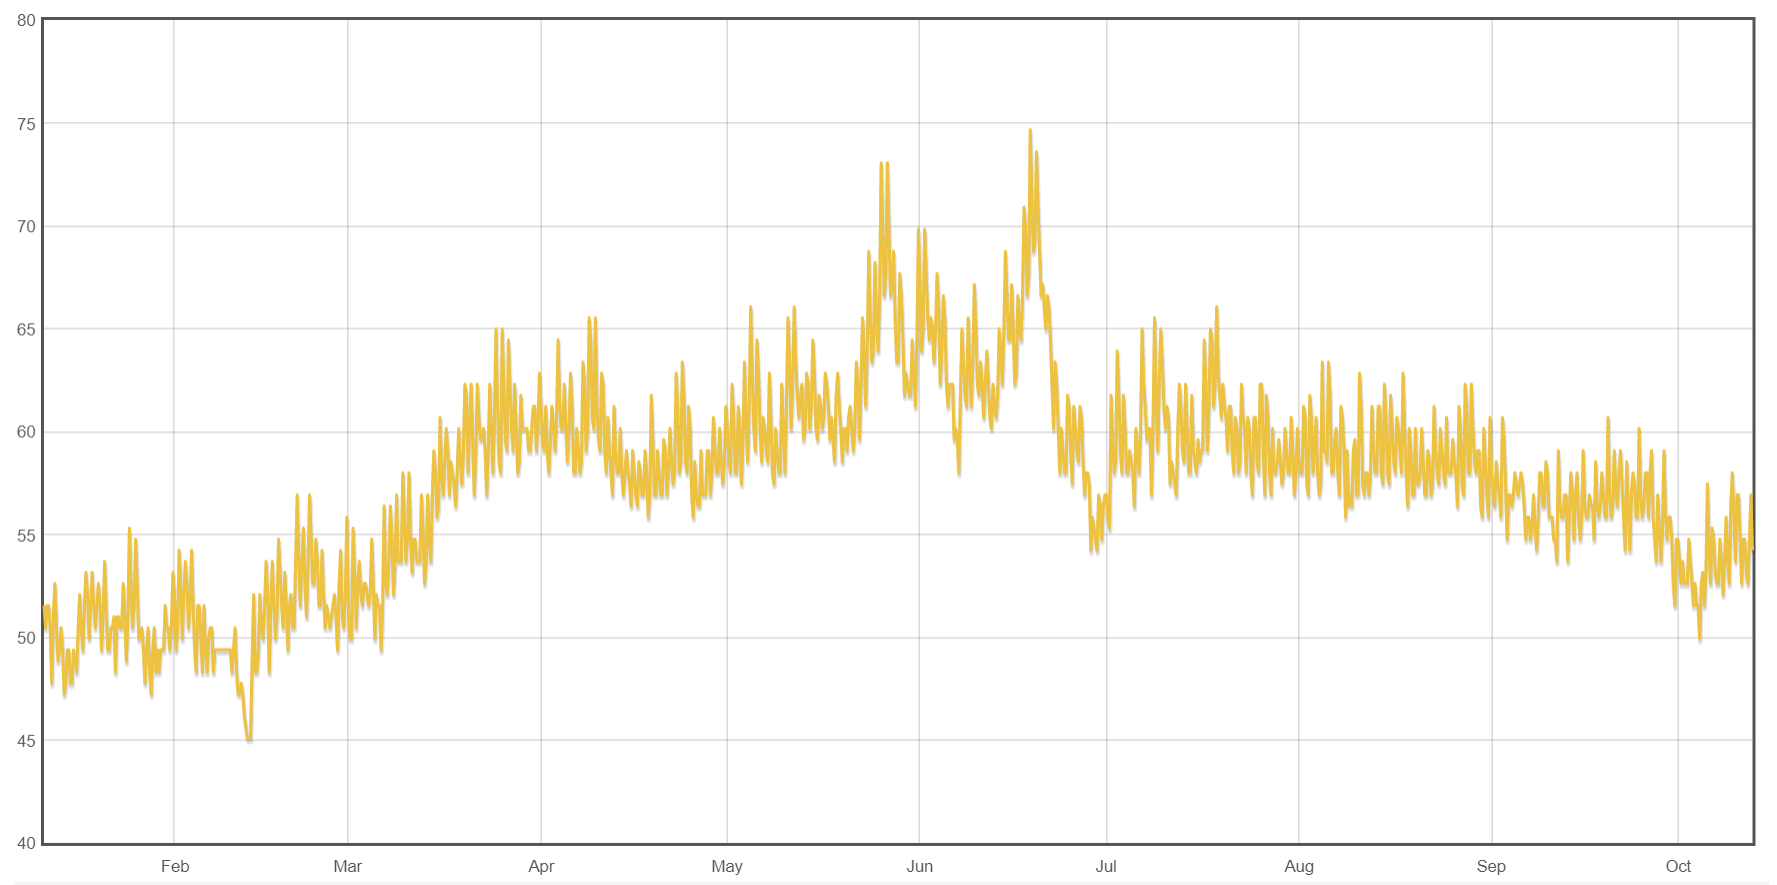
Here’s a graph from one of my early installs
You can see it peaks out at 75°C in June, which you might think is ok, but this monitor is installed in a plantroom/loft that gets extremely hot, this particular monitor I had to fit a PWM controlled fan to the box to keep it as low as possible. the fan is only small and varies between 40% and 100% duty cycle, from about 60°C it is on 100%.
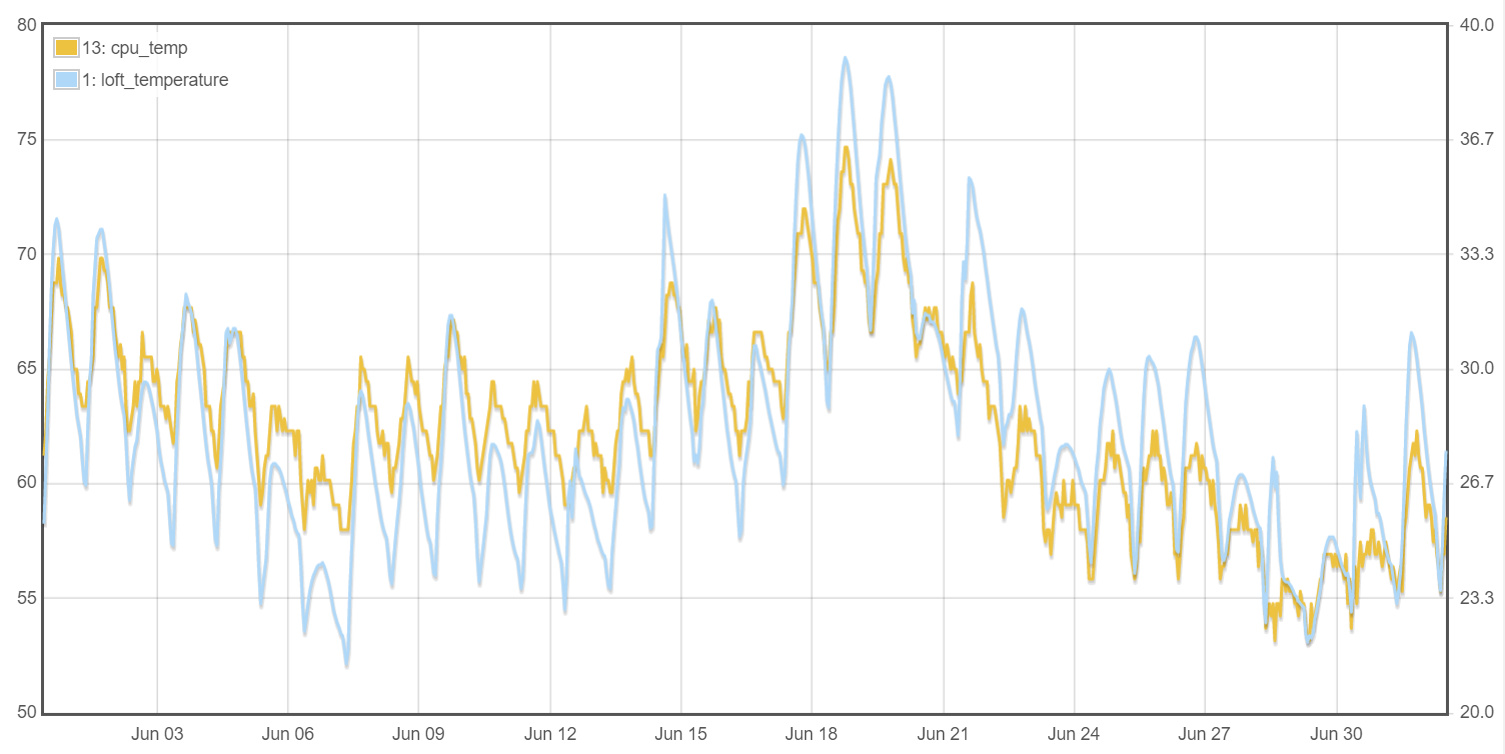
But a fan is of little use when the ambient temperature is so high
see how the Pi’s temp tracks the ambient temp, when the ambient temp is nearly 40°C we can expect the cpu temp to peak at 75°C.
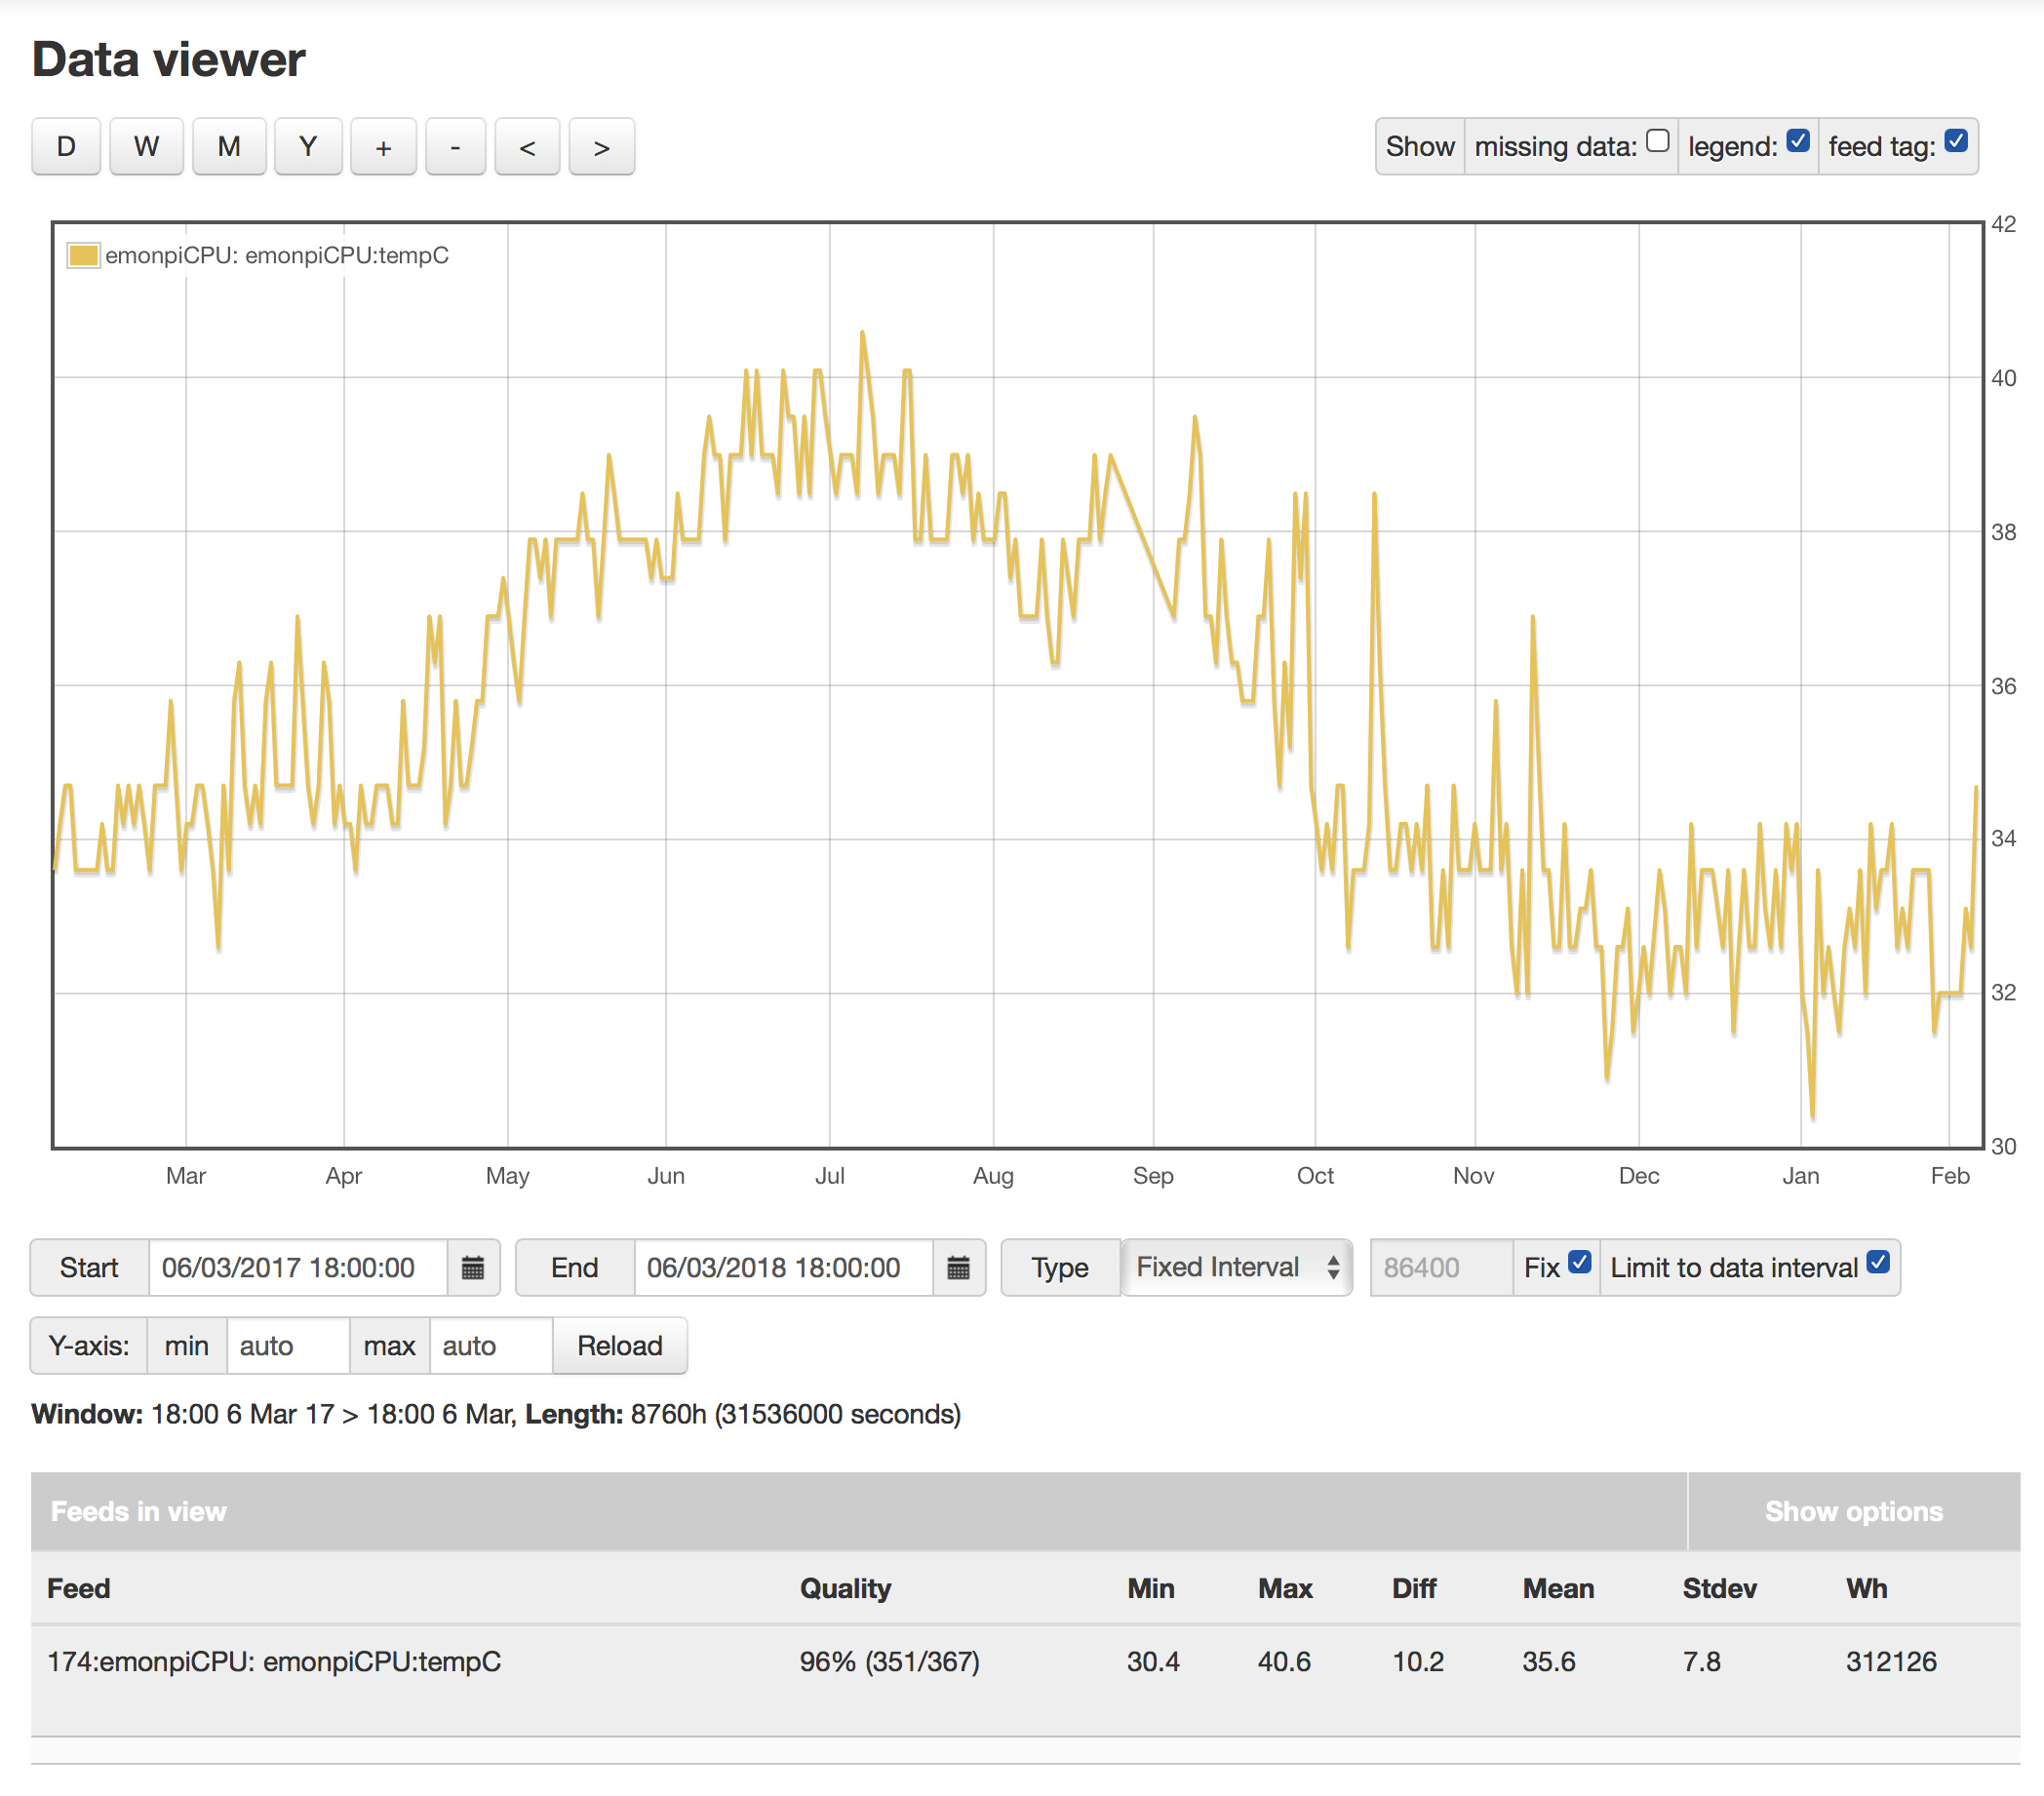
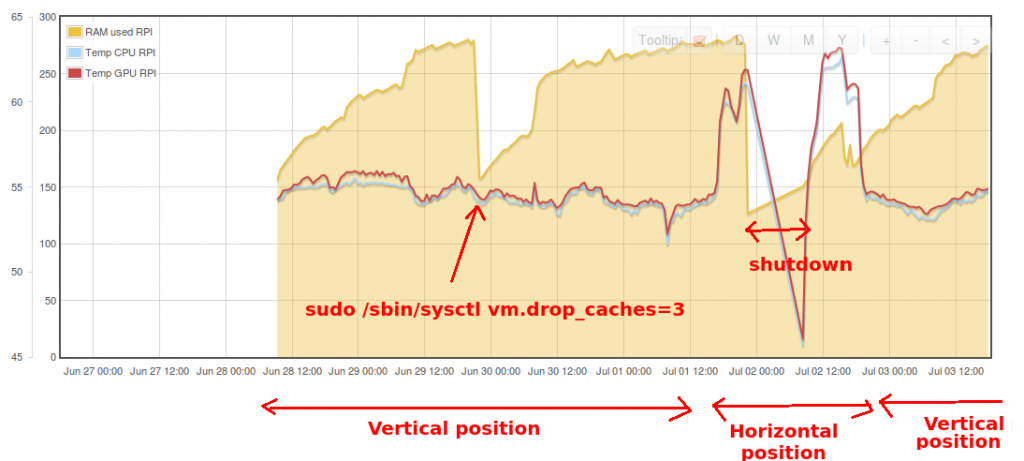
As a side note, the load on this Pi was drastically reduced (and therefore the temp lowered a fair bit) by changing the network settings to block unknown IP’s, by tracking the cpu load and logfile size I determined the Pi was under brute force ssh attacks, once they were blocked, the temp dropped.
I use python scripts that post to an emonhub socket, I don’t yet have a specific script I use for all sites, it has sort of evolved over time and I just add bits and cut away bits as needed. My intention is to eventually create an emonhub interacfer that does this internally. A user can then just configure it how they want by picking values from a list of available data to make up their own payload.
I did bring this up when the admin page was populated with temperature and disc sizes, but there was no interest then. The admin page stats are nice to have, but they offer little more than eye candy for the rare times a user logs in.
For example disc usage, if the disk usage is monitored over time, users could graph the delta to see what space they are consuming per day/week/month/year etc, this could help plan for the future (will I run out of disc space), spot issues (why did i consume twice as much data this week?) and even help evaluate the cost of shared hosting and/or using emoncms.org etc.
Logging the use of var/log could help fine tune ram usage and logrotation etc.
Actually that’s the GPU temperature, CPU temperature can be read with cat /sys/class/thermal/thermal_zone0/temp (it requires dividing by 1000)
pi@emonBase24(ro):~$ cat /sys/class/thermal/thermal_zone0/temp
51540
pi@emonBase24(ro):~$ /opt/vc/bin/vcgencmd measure_temp
temp=52.1'C
Here’s an (early) example script, I have a monitor sat here that was temporarily installed to a
building due to be demolished and it was subsequently removed to be reused elsewhere. Therefore it doesn’t have any disc, ram or cpu load monitoring.
#!/usr/bin/env python

import RPi.GPIO as GPIO
import time
import os
import socket

host = "localhost" #emonbase1"
port = 50012
nodeid = 13
interval = 5

fan_pin = 18
stall_percent=40   # max steps set to 100 set this to the min steps required before the fan stalls
temp_run=40
temp_max=55


# Return CPU temperature as float
def getCPUtemp():
    cTemp = os.popen('cat /sys/class/thermal/thermal_zone0/temp').readline()
    return float(cTemp)/1000

def getCPUtemp2():
  try:
    tFile = open('/sys/class/thermal/thermal_zone0/temp')
    tempC = float(tFile.read())/1000
    tFile.close()
  except:
    tempC = 300
  return tempC

def getWiFiData():
  try:
    tFile = open('/proc/net/wireless').readlines()
    tArray = [float(i) for i in tFile[2].split()[2:4]]
    tFile.close()
  except:
    tArray = [0,0]
  return tArray

# Send the frame of data via a socket
def send(f):
    s = socket.socket(socket.AF_INET, socket.SOCK_STREAM)
    s.connect((host, port))
    f = f + '\r\n'
    s.send(f)
    s.close()

# Set the PWM of fan pin
def adjFanSpeed(CPU_temp):
    if  CPU_temp > temp_run:
        FAN_cycle = (((CPU_temp - temp_run)*fan_ratio)+stall_percent)
        FAN_cycle = min(100,max(stall_percent,FAN_cycle))
        p.ChangeDutyCycle(FAN_cycle)
    else:
        p.ChangeDutyCycle(0)
        FAN_cycle=0
    return FAN_cycle

GPIO.setwarnings(False)
GPIO.setmode(GPIO.BCM)
GPIO.setup(fan_pin,GPIO.OUT)
GPIO.setwarnings(False)
p=GPIO.PWM(fan_pin,50)
p.start(75) #instant start
fan_ratio=((100-stall_percent)/(temp_max-temp_run))

lastsend = time.time()//interval*interval
while True:
    t = time.time()//interval*interval
    if t >= (lastsend + interval):
        CPU_temp = getCPUtemp2()
        FAN_cycle = adjFanSpeed(CPU_temp)
        WIFI_data = getWiFiData()
        f = ' '.join(str(val) for val in [int(t), nodeid, int(t), CPU_temp, FAN_cycle, WIFI_data[0], WIFI_data[1]])
        lastsend = t
        print f
        send(f)
    time.sleep(0.10)

GPIO.cleanup()