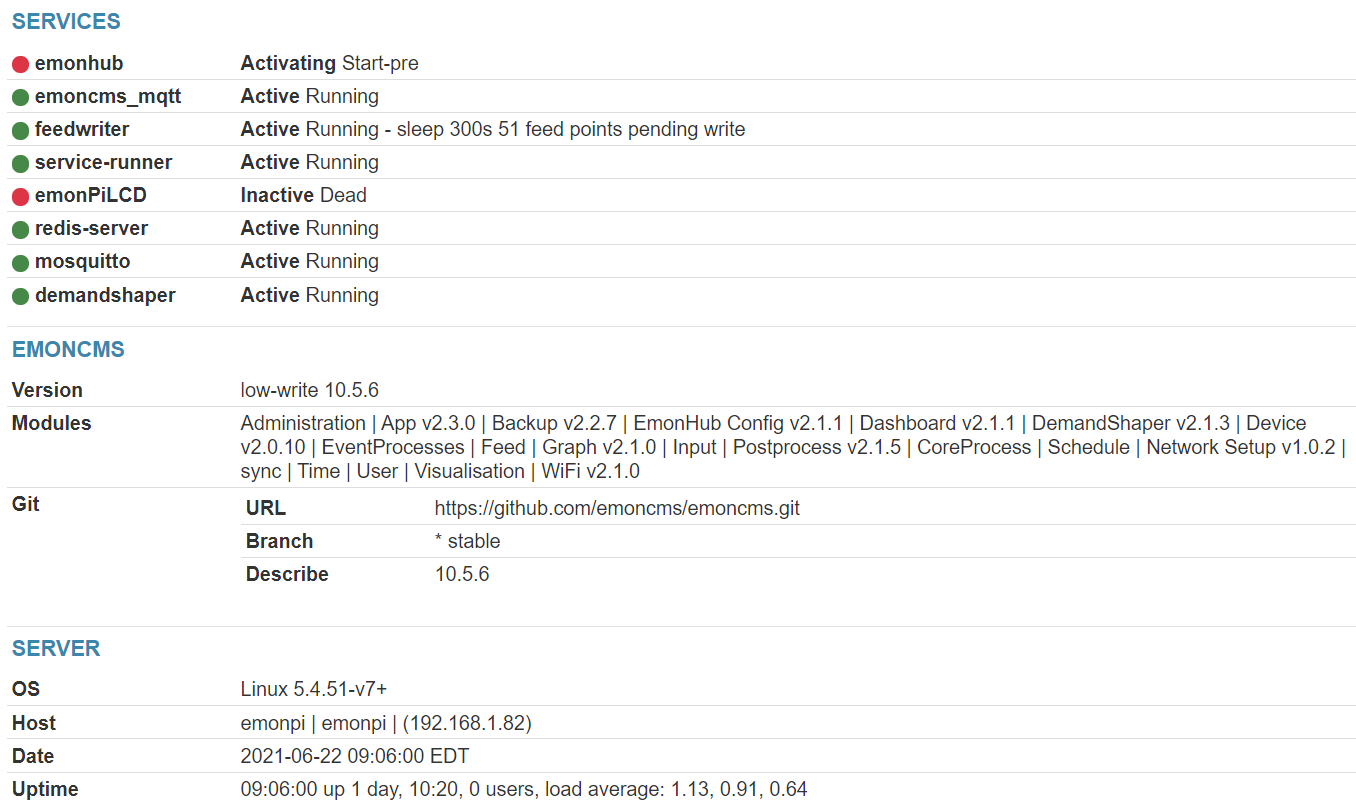
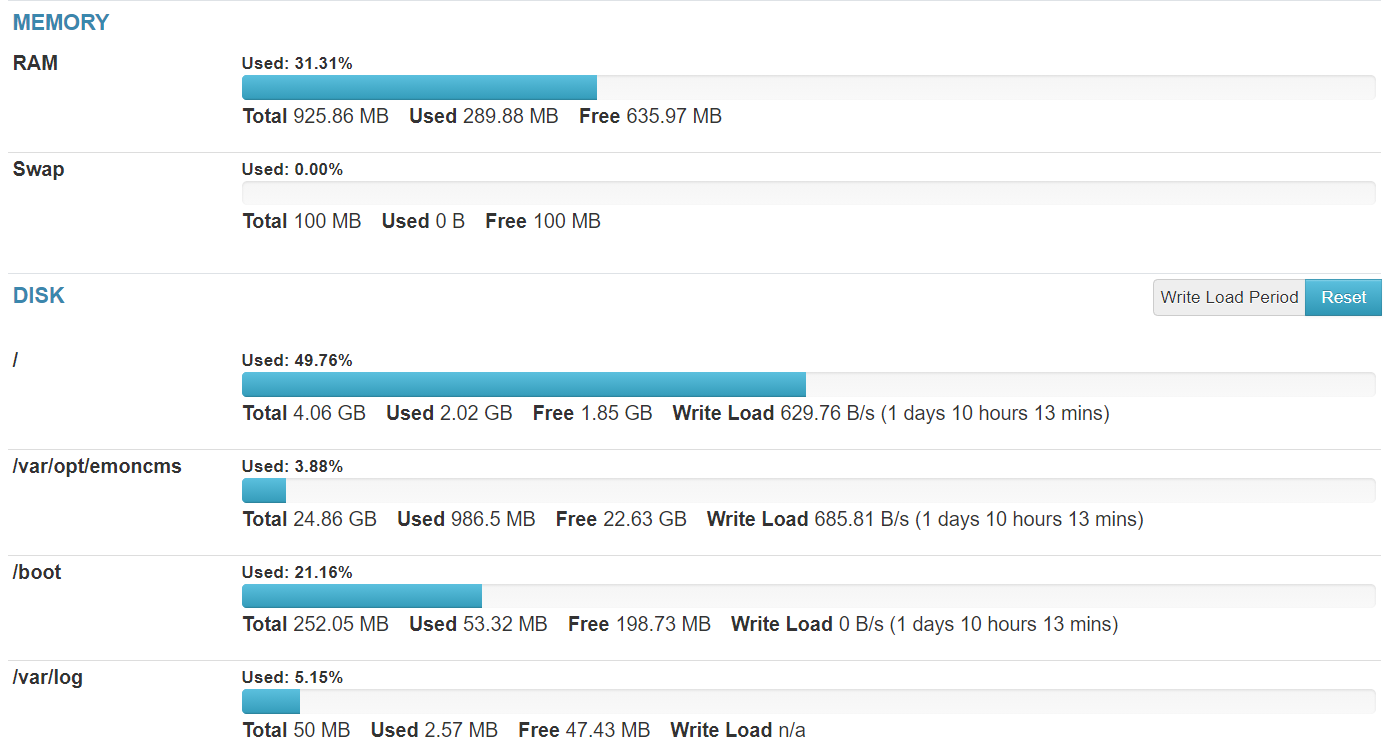
I’m running emoncms low-write 10.5.6 version on a Pi 3 Model B (Rev 1.2) with 1 GB memory. I’ve got about 140 Feeds running and about 12 dashboards hosting about 20 multicharts. This setup operates very nicely, except that RAM use continuously increases. After running about 10 days, RAM use reaches ca. 70% and Swap use starts increasing. After a couple of more days, Swap reaches 100% and soon the emon server fails (that is, I cannot login to emon and/or Feeds no longer accumulate). This chart shows two cycles, one with default Swappiness of 60, and a cycle that finished last night with Swappiness set to 1.
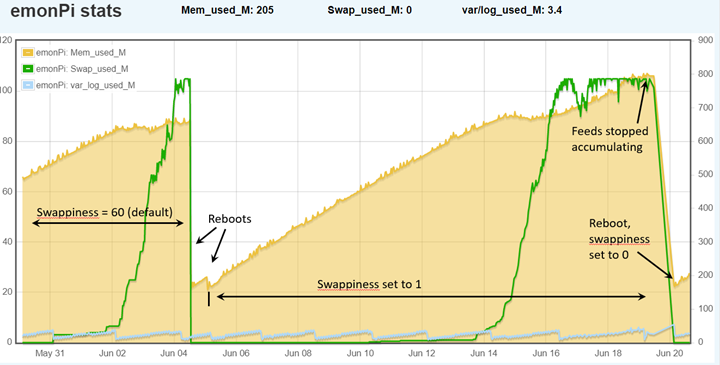
Mem_used (aka RAM) is scaled on the right side axis while Swap_used and var_log_used is scaled on the left axis. I’m recording the RAM and Swap as revealed by free and the var_log use is log2ram use from df –h.
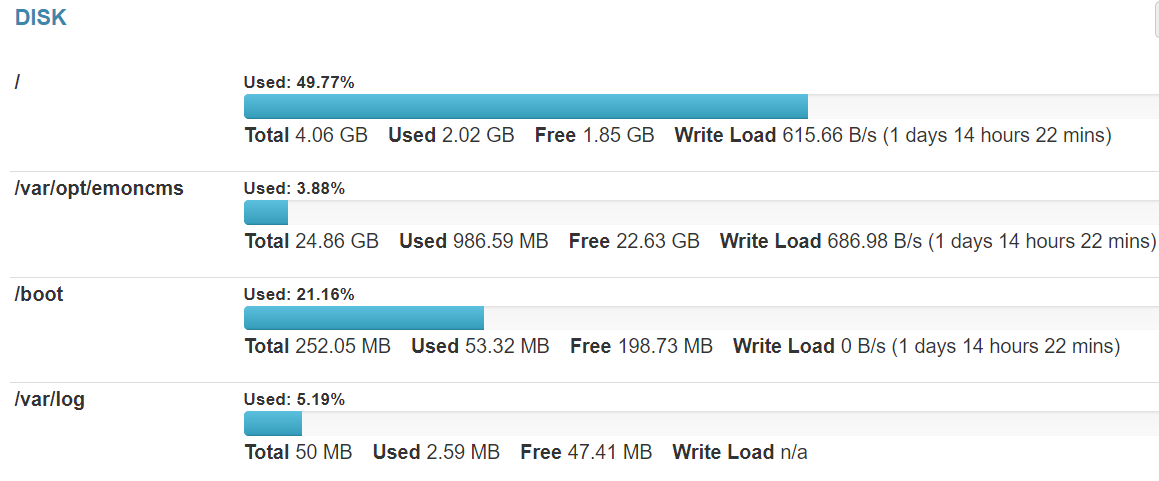
The good news (I think), is that var/log is behaving as expected.
What could be causing the continuous increase in Mem use? Using htop, I see there are 40 mysql processes each listed as using 6.5% of MEM. But I am not experienced enough to troubleshoot memory use problems further. I’m happy to diagnose this memory problem more if someone can give me pointers on what to do.