Hi Robert,
Thanks for taking the time to write up a guide for us to use, my main goal for the EmonPi is to provide a day/week/month overview of our power usage in the form of a graph, both in watts used and Kwh (daily/monthly).
My understanding is that even though pulse monitoring is not ideal, it should work for this use case, as the granularity I seek is not high, 60s for instance is perfectly acceptable, as this is primarily to see trends and patterns within our power usage, not for instantaneous feedback.
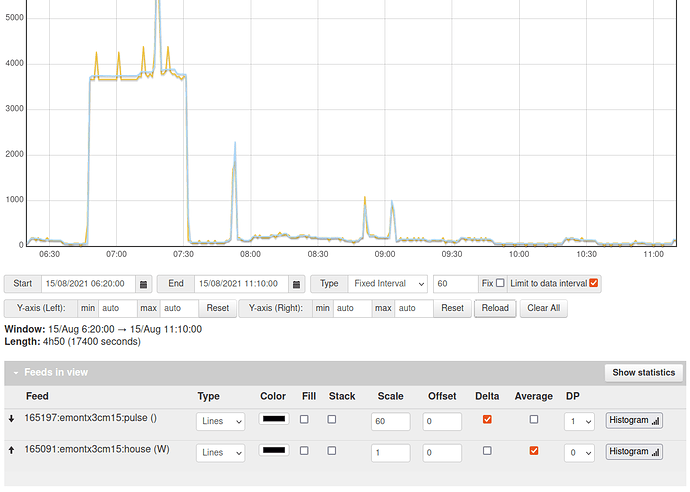
I followed your guide, but was unable to get the right results, the graph swaps between 0W and 720000W of power usage, in a binary fashion, there’s no in-between.
My guess is that the power input is not quite designed for the pulse to happen every 0.01kWh but rather every Wh or such? And as a result provides some mangled data?
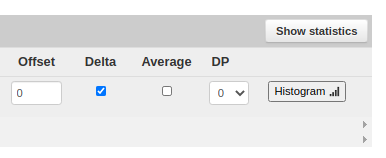
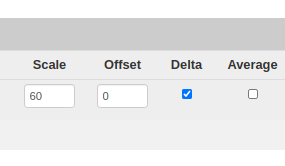
I’m still confused as to how you’re meant to take a “pulse every x” and convert it into the more appropriate values, I see in the guides you can multiply it by a specific amount, but that still doesn’t seem to work, no matter the direction we go.
The pulse graph has been running on it’s own for a little while now, and it’s definitely showing the correct patterns, i.e. where the graph shoots up significantly faster during the day than the night, which is correct for the office environment it’s deployed in.
It’s worth noting that the EM210 power meter it’s connected to does also show real-time Kw usage on it’s built in display, so we have a reference baseline to compare to, say if we had a minutely average, I could cross check it whilst physically looking at the readout and make an informed assessment of wether we’re in the right spot with our calculations.
Further, there’s no issues with the actual readout, I can confirm the EmonPi is getting every single pulse, the probe was purchased with the EmonPi and is the original one, taped directly to the light output on the reader, there appear to be no difficulties in it reading the pulses, as I can see the Kwh readout on the reader increase by 0.01 each time the LED on the probe pulses.
My original suggestion of it missing some was misguided as I thought that perhaps the 10s measurement would only read one pulse within those 10s or similar, I had not understood that it was simply an aggregate function of pulses within those 10s.
Let me know if you have any other suggestions on how we could tackle this readout, so far no luck.

 - so your scaling problem with the 10 Wh per pulse is solved. Then, being an inquisitive so-and-so, I changed it to ×0.1, and that worked too.
  )
)

