After doing an SD card upgrade today I see a new visualization listed as “psychrometric diagram”.
I’ve looked around and can’t see any documentation on this.
Does anyone know where I should be looking?
After doing an SD card upgrade today I see a new visualization listed as “psychrometric diagram”.
I’ve looked around and can’t see any documentation on this.
Does anyone know where I should be looking?
Have you tried searching?
The search tool is the little magnifying glass on the blue bar at the top right of your screen.
You’ll be the helpful one on the forum?
I was about to add that experience tells me that comprehensive documentation is often not very high on the priority list here, and my usual advice is you must try it out and find out for yourself.
Searching does actually find one topic - this one!
I think “search” - in the light blue bar, searches only this forum. The search in the dark blue bar also searches the old (now archived) forum, Github, etc.
Hello @Mike_Henderson this feature was kindly contributed by @alexandrecuer there’s a little info included in the original pull request here Psychrographs in the vis module by alexandrecuer · Pull Request #1697 · emoncms/emoncms · GitHub, @alexandrecuer noted that he will add some documentation on this but Im sure will be happy to help with your questions here
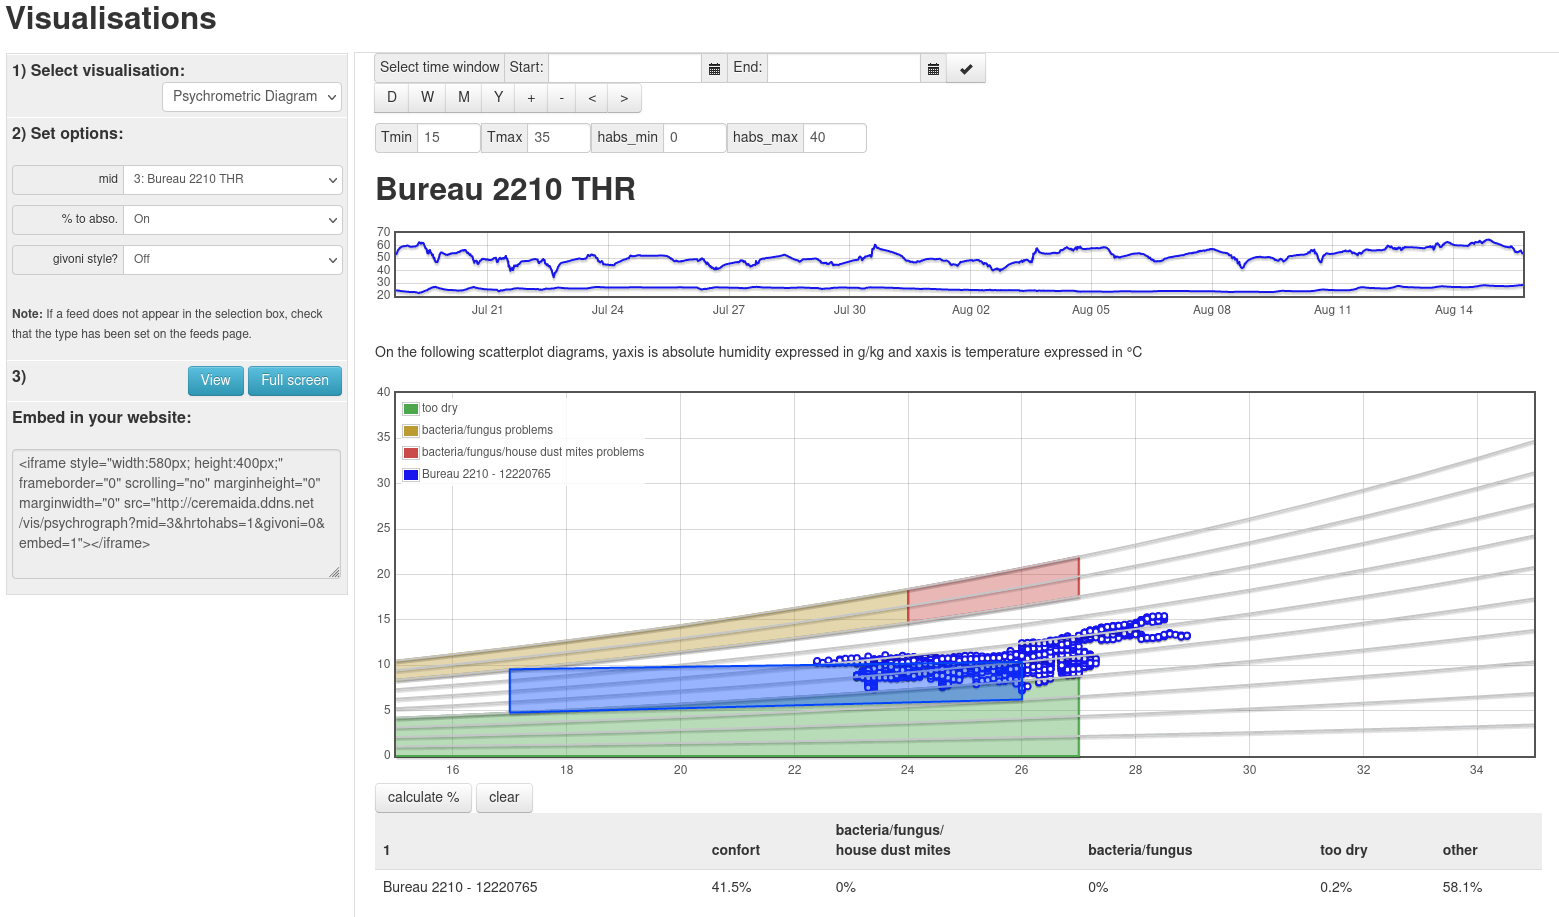
@Mike_Henderson : psychrographic diagrams are a way to appreciate the thermal comfort of a house. All you need is a simple sensor of temperature and relative humidity. The principle is to represent the absolute humidity as a function of temperature.
The graph is initially populated by 10 curves of relative humidity, represented in light gray. The lower curve corresponds to a relative humidity of 10%, the upper one to a relative humidity of 100%.
We then materialize the zones where it’s not good to be:
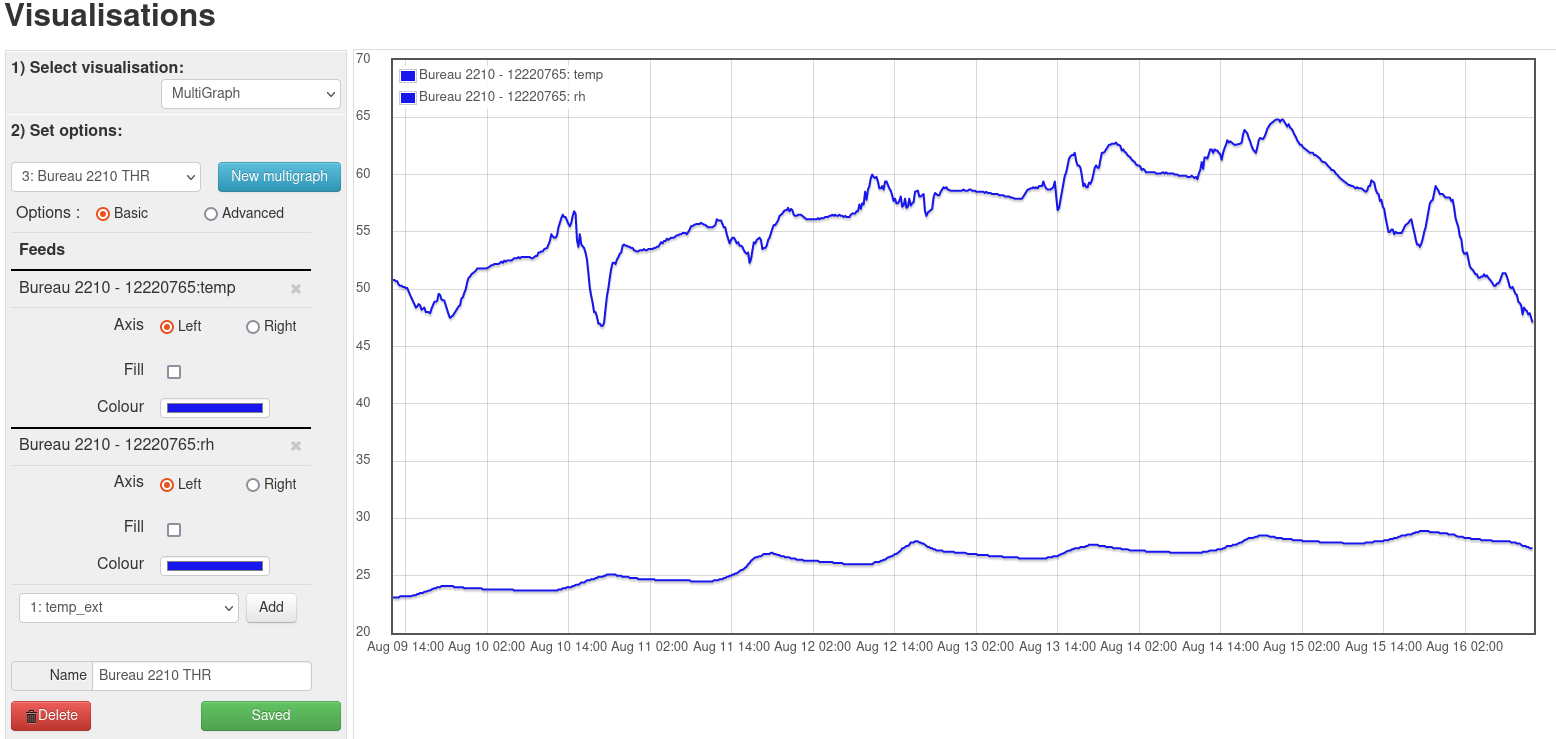
from a practical point of view, you just have to build multigraphs in emoncms and use them in this pshychrographic visualization to appreciate the comfort level of your home
@alexandrecuer: Many thanks for the explanation.
I already understood the purpose of the diagram and how to read it, what I struggled with was the configuration of the Multitrends.
With that bit of information I’ve set up a graph and I’ll look to adding this into my home dashboards.
Thanks for creating this handy utility.
@Mike_Henderson : OK, thanks for the feedback, nice to hear.