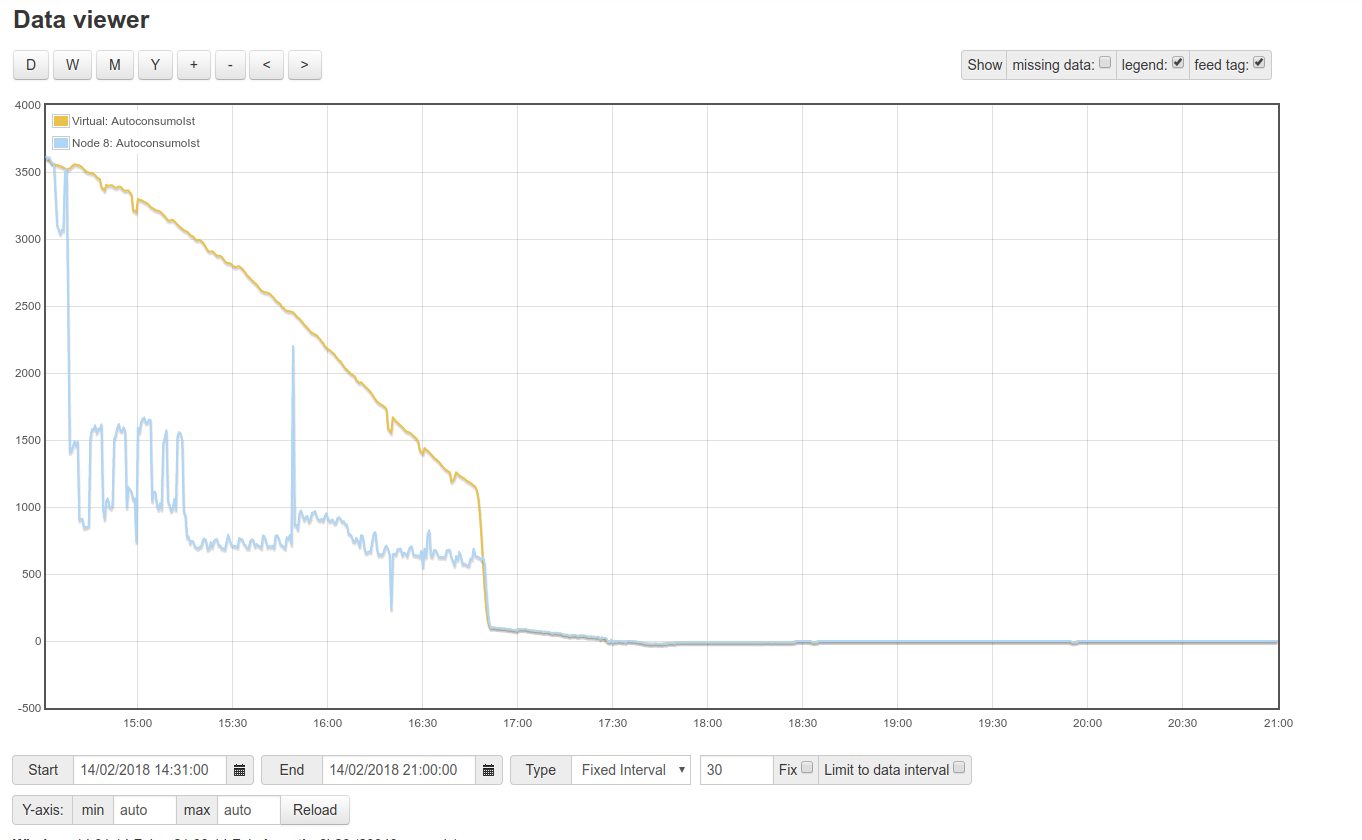
Hello, i’m trying to use virtual feeds to display the self usage of my solar panels but strange things happens.
If i create a “standard” (PHPFINA) feed everything seems fine but if i create a Virtual feed… values are totally wrong.
Both feeds are the result of the two feeds FV_Production - Energy_sold but in the attached images you can see that the virtual feed is totally wrong.
There’s something i’m missing? There are problem with virtual feeds?
There isn’t really enough info here to even take a guess.
Can you tell us what the “FV_Production” and “Energy_soldfeed” types are?
Can you tell us or show us your processing? Which inputs are your processes in?
Where is the data coming from? How often are the inputs updated?
Is the error consistent when you refresh the graph or look at different resolutions (zoom in/out or different days)?
The traces seem to start off the same and end the same, to me they look quite valid and suggest they might not be displaying what you intended, rather than being just “wrong” as in there’s a “fault”.
Can you display those 2 feeds that these feeds are derived from, on the same graph for comparison?
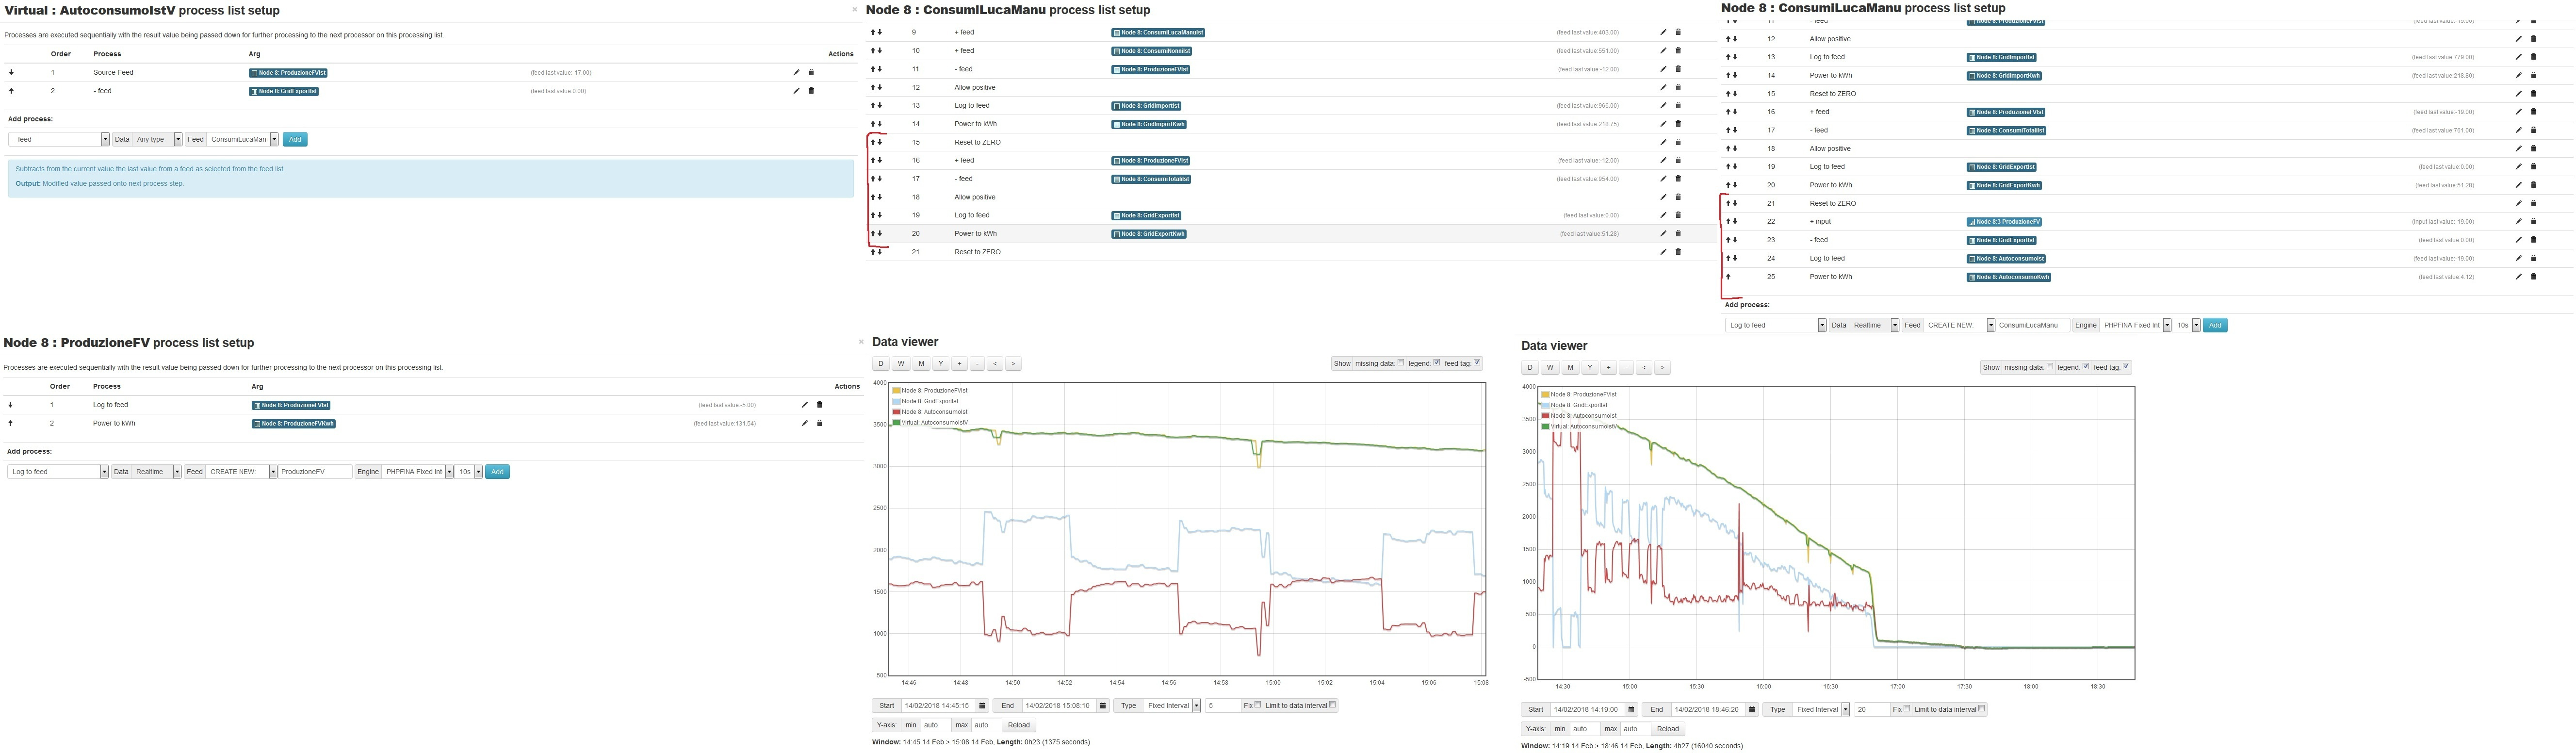
I’ve attached the images with the info you requested about the feeds ProduzioneFVIst (watt) and GridExportIst (watt).
Inputs are updated every 10 seconds and is coming from an emonTX that transmit data to an emonBase attached to my network.
Error is consistent even if zoom in/out (see attached images) and probably i cannot understand how to use the virtual feeds …
On your virtual feed you use ‘- feed’ that means - the last value of that feed.
You must use ‘- source feed’ so that it takes a value for each time point on the graph.