PHPTimeseries feeds and missing points in graph

Scenario
I am using emoncms to store central heating data (temp, demand and setpoint) from a wiser heating controller very similar to their cloud but offline on a private network. They don’t allow uploading or downloading of the raw data.

demand and setpoint are PHPTimeseries as there is very little data and it changes slowly. Demand is potentialy only 9 data points a day. I did try writing demand and setpoint every 30 mins even if they don’t change and that helps a bit.

I am using graphs to look at the data

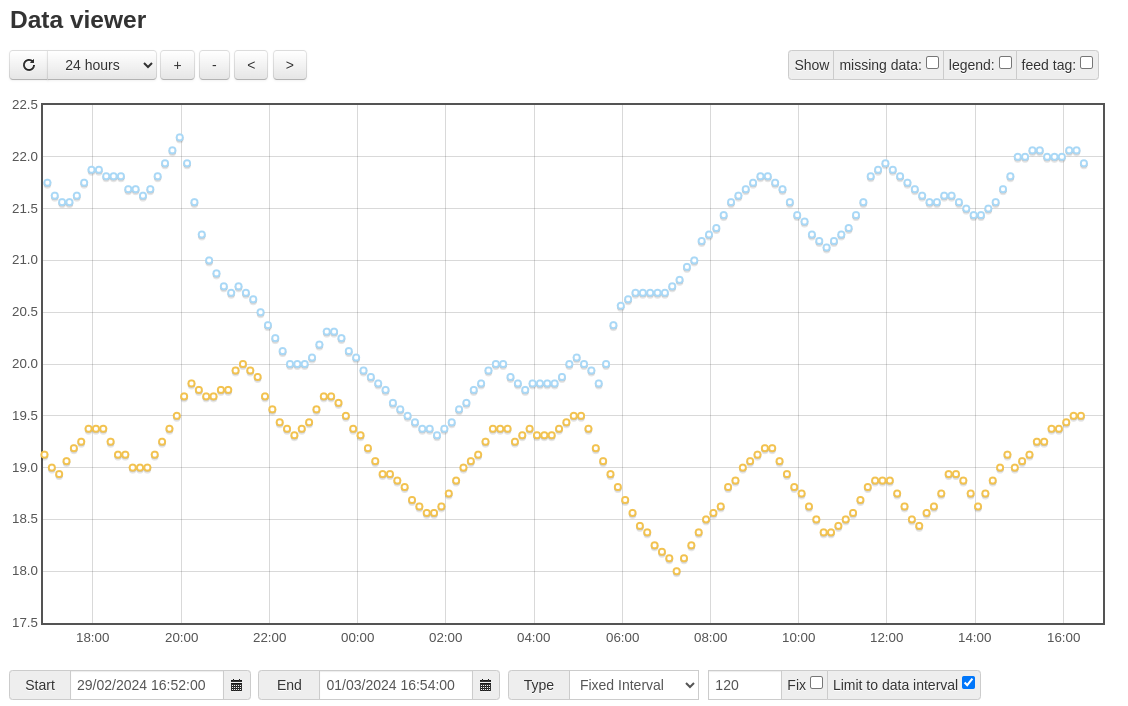
The temp is PHPFina every 5 mins and graphs beautifully over all time intervals

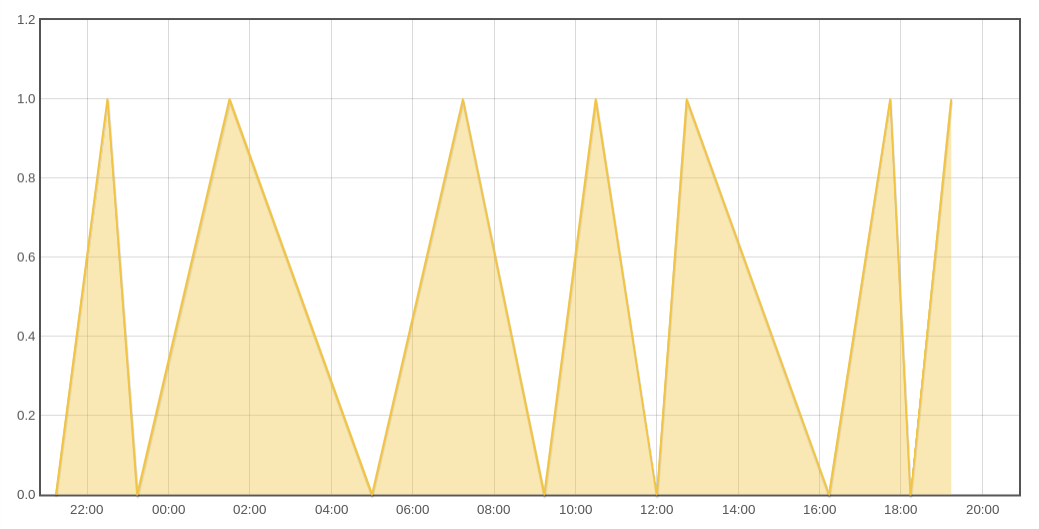
The setpoint has some major issues with missing data when showing 24 hours of data, the week view is even worse

The CSV Output for the setpoint when showing 24 hours fails to show multiple data points

Minimal interval for the setpoint data is 15 seconds, max 30 mins

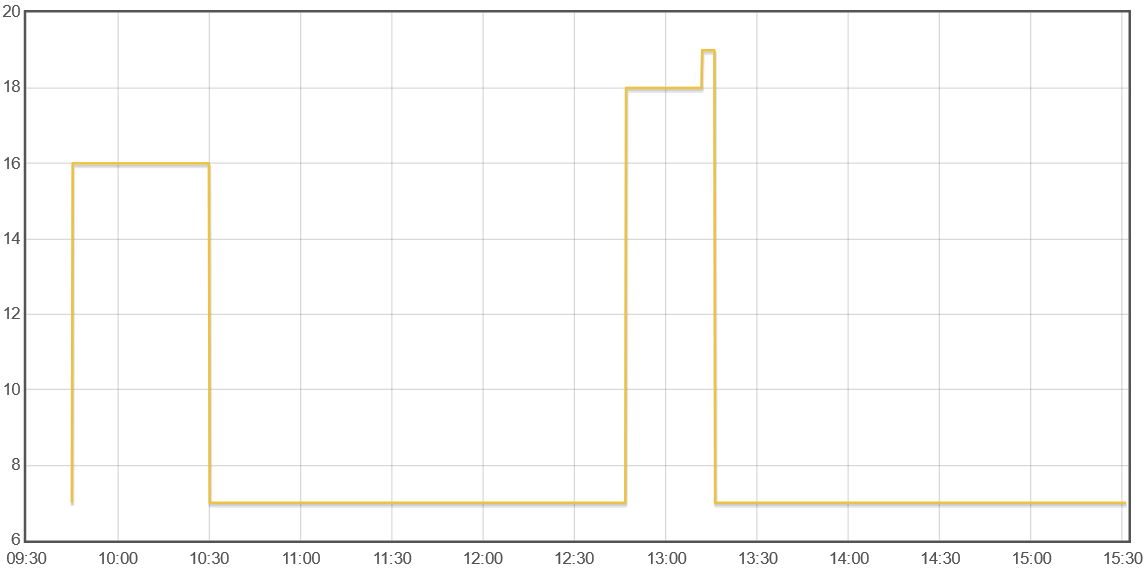
Digging into the json query for Reload the 24 hours

http://172.24.3.1/emoncms/feed/data.json?ids=53&start=1709216520000&end=1709303040000&skipmissing=0&limitinterval=0&apikey=&average=0&delta=0&interval=120

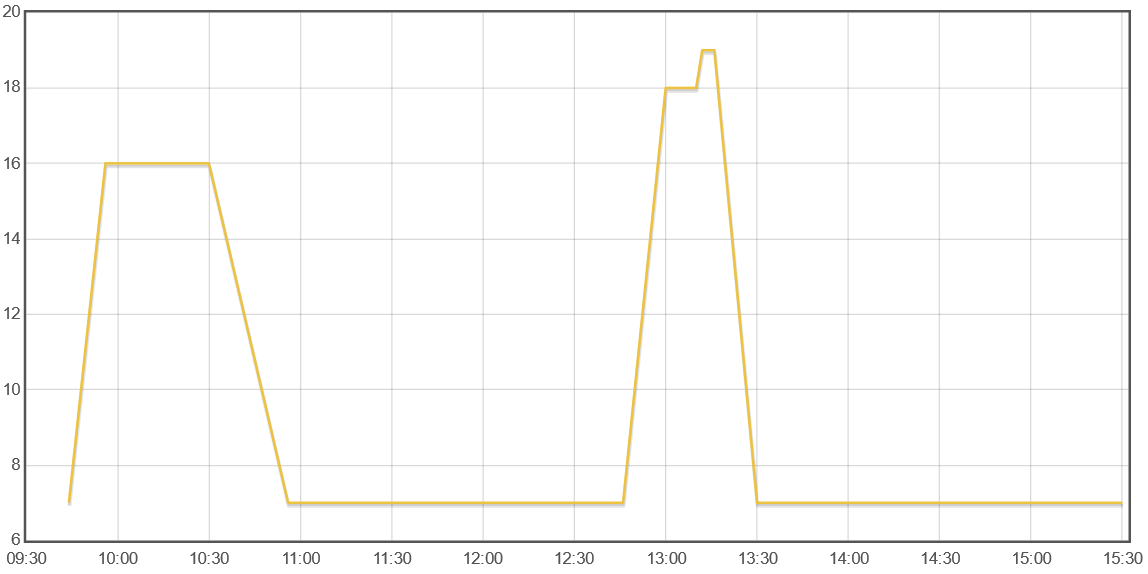
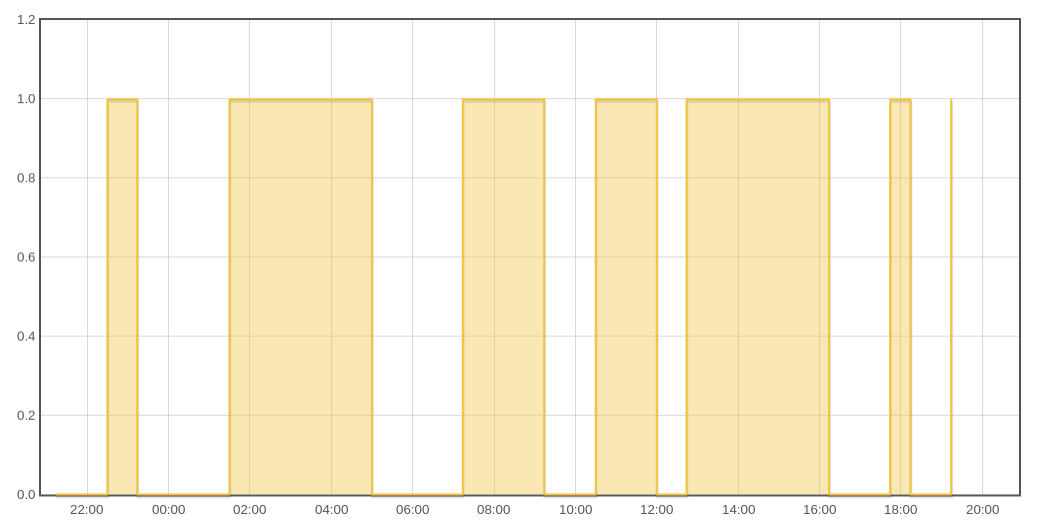
If I change the query to reduce the interval to 15s

http://172.24.3.1/emoncms/feed/data.json?ids=53&start=1709216520000&end=1709303040000&skipmissing=0&limitinterval=0&apikey=&average=0&delta=0&interval=15

then the data appears, the csv says its there and the setpoint graph is correct

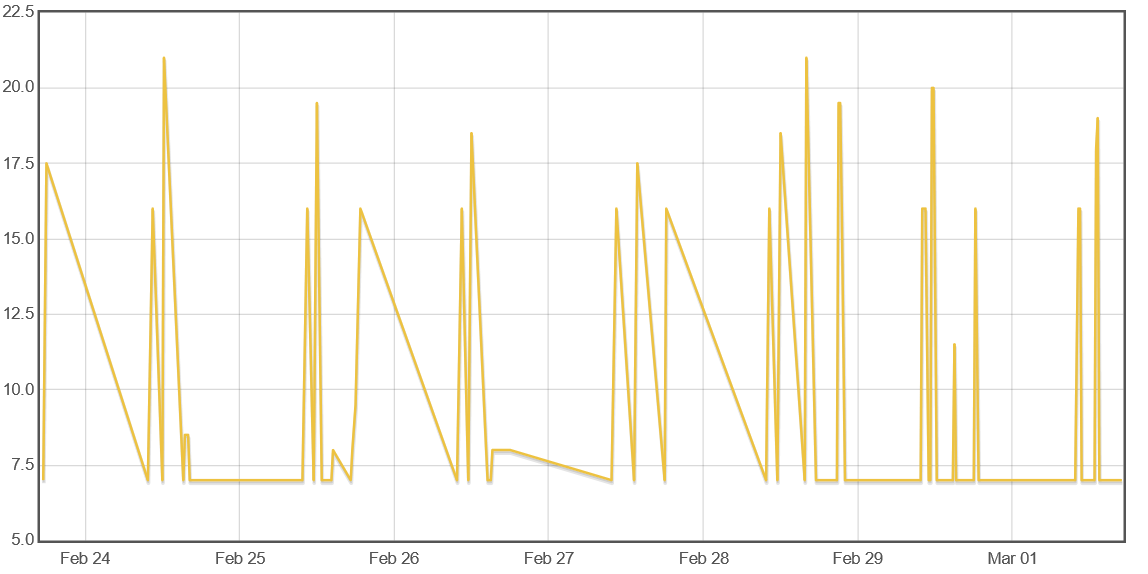
if I try and look at the week view then I get a mangled graph by default

if I try and drop the interval for the week view then I get

Request error: request datapoint limit reached (8928), increase request interval or reduce time range, requested datapoints = 60576

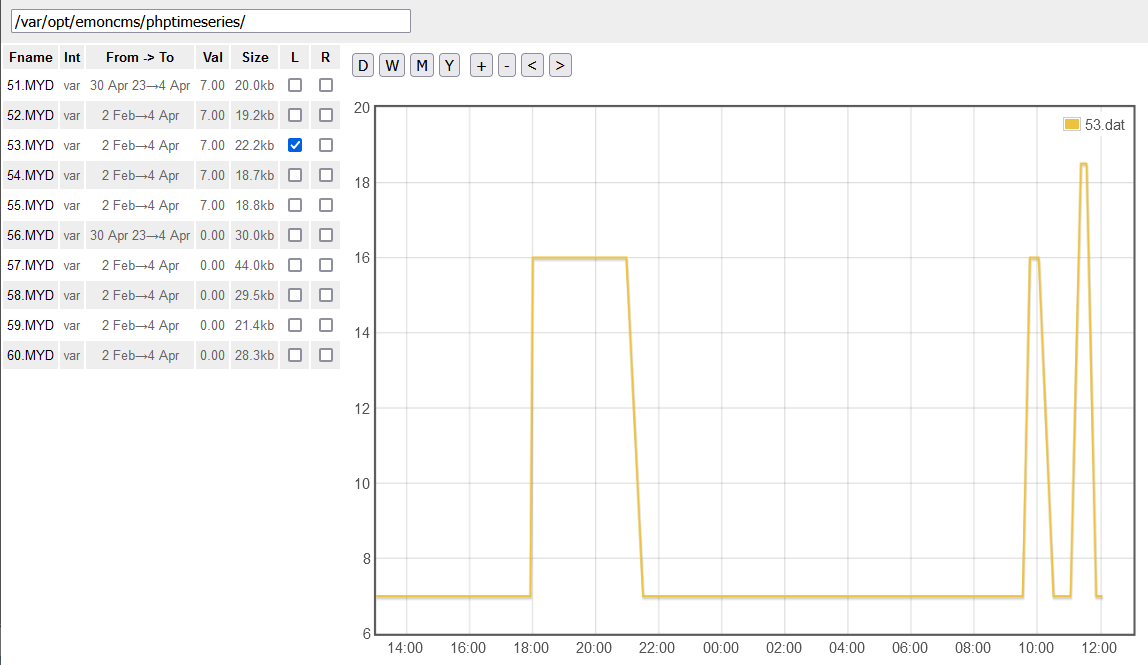
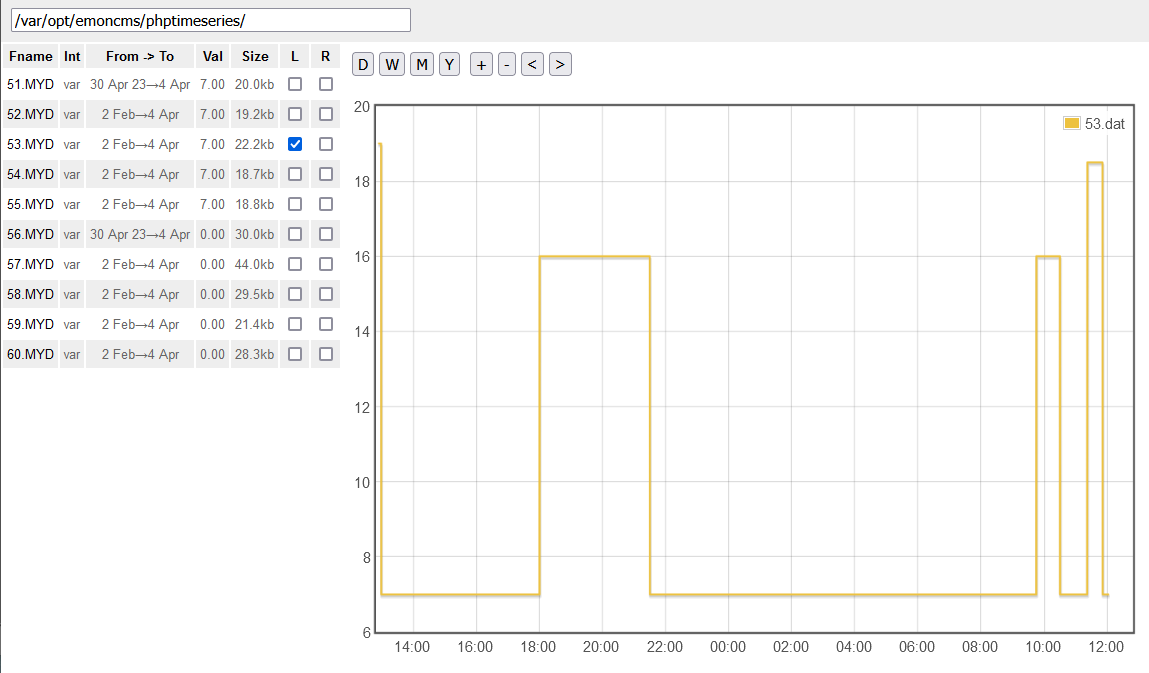
I have double checked that all the data is there by using data_downloader.py and convert_to_csv.py scripts to dump the PHPTimeseries data

screen shots and raw data available on request

What I think is involved

This could be the json download and/or the graph module. As it will graph OK if the interval is 15 I am leaning towards the json. So I may have raised this issue in the wrong place

Why I think its happening

A PHPTimeseries does not have a fixed interval so trying to download the data using one could be a mistake in three ways.

The downloaded data is

  • going to be full of nulls
  • massive for longer time periods and could easily hit the max download limit
  • potentially missing data if the interval is too long.

It would produce a much more efficient and complete response if it just gave you the actual data points from a PHPTimeseries feed between the start and end time.

That should totally eliminate interval issues. Probably best to limit max results to 8928 just in case someone is using the wrong time series.

Possibly the interval graph options should be hidden for a PHPTimeseries feed

What do you think about my conclusions ?

I might have a look at the code myself if pointed in the right direction and if this is the right way to fix this

Hi! Welcome to the forum. :slight_smile:

I’m not sure I understand the problem you’re seeing. I use several variable timeseries feeds myself, and they all graph just fine. If you can share some screenshots of what you’re seeing, that will help (I’ve upgraded your account so you should be able to do that now).

What version of EmonCMS are you running with?

Here’s an example showing two variable feeds over 24 hours, with 10 minute intervals that are out of sync:

The week view also looks fine, though is slightly improved by ticking the Average option for each feed.

Hi Tim

Emoncms Version: low-write 11.4.9

6 hours worth
interval 120

interval 15

7 days

Thanks

Ah right, the trouble you’re having is those feeds are only recording when the values change, whereas EmonCMS is really expecting to receive more regular data (e.g. every 10 seconds).

Yes, this will help a bit, but the Graph still isn’t best suited for plotting discrete values.

Comparing your first two charts “interval 120” vs. “interval 15”, is it the sloped sides that you object to? This would look better if drawn with “Steps”, which was requested by this topic:

I’ve recreated the type of feed you have, where only changes are recorded.

Here’s that same data plotted with steps: (using my pull request)

The code change is quite simple, if you’re able to apply it to your instance.

If I’m understanding you correctly…?

@TrystanLea - looks a great enhancement.

It is the sloped sides that are part of the problem, the other half is missing points

I have had a look at Steps and it graphs discrete values very well and applies exactly the right formatting with the lines and steps. That would definitely save me a few data point as I am curently writing the old value then the new 15 secs later when things change

So great enhancement Thanks for letting me know it exists

I still have a missing data issue though

2024-03-01

phpTimeseries Interval120 Interval 15
08:57:16, 7.0 08:57:00, 7 08:57:15, 7
09:27:16, 7.0 09:27:00, 7 09:27:15, 7
09:45:02, 7.0 09:45:00, 7 09:45:00, 7
09:45:16, 16.0 09:45:15, 16
09:57:17, 16.0 09:57:00, 16 09:57:15, 16
10:27:17, 16.0 10:27:00, 16 10:27:15, 16
10:30:01, 16.0 10:30:00, 16 10:30:00, 16
10:30:23, 7.0 10:30:15, 7
10:57:50, 7.0 10:57:30, 7 10:57:45, 7
11:28:01, 7.0 11:28:00, 7 11:28:00, 7
11:58:49, 7.0 11:58:30, 7 11:58:45, 7
12:29:16, 7.0 12:29:00, 7 12:29:15, 7
12:46:47, 7.0 12:46:30, 7 12:46:45, 7
12:47:01, 18.0 12:47:00, 18 12:47:00, 18
13:00:01, 18.0 13:00:00, 18 13:00:00, 18
13:11:46, 18.0 13:11:30, 18 13:11:45, 18
13:12:01, 19.0 13:12:00, 19 13:12:00, 19
13:16:01, 19.0 13:16:00, 19 13:16:00, 19
13:16:16, 7.0 13:16:15, 7
13:30:01, 7.0 13:30:00, 7 13:30:00, 7
14:00:16, 7.0 14:00:00, 7 14:00:15, 7
14:30:31, 7.0 14:30:30, 7 14:30:30, 7

As you can see there are some 15 min holes in the interval120 column and the data is missing from the graph with and without Steps.

All the data is there in the Interval15 colums and the graph is complete too

I was wondering whether the best solution to the data missing part is to grab the PHPtimeseries data between the intervals and then bolt them (or the missing ones) into the nearest available spot in a fixed interval set of null data.

If you get my drift …

Hi Steve,

Graphs don’t deal with PHPTimeSeries very sensibly, IMHO. I’ve posted several threads over the years about the issues. Here’s a couple of recent ones:

I posted a patch for an issue years ago but it never got incorporated, so I’ve given up.

Hi Dave

I have had a mixed experience with producing patches, some have gone in quickly and other languished for quite a while as they gathered public support. I have been the beneficiary of someone else pushing for one of my patches to be applied.

I think its still worth reporting things just in case other people have patches up their sleeves like Timbones above. I think that the ops are prioritising in the usual way and I do find myself in the 0.01% club of people that use a particular feature which wrecks my chances sometimes.

I keep a few patches up my own sleeve that I have never tried to get adopted. It does make updating a bit of a nuisance though.

I spent a while “fixing” the look of the web interface on mobile phones and tablets. Mainly to try and get everything on one screen but also deal with landscape/portrait issues. It may see the public light of day sometime.

I am currently playing with Trystan’s PHPFina standalone viewer so that I can dig a bit deeper into PHPTimeseries data and graphing.

working on Trystan’s PHPFina standalone viewer, thought it should be easier than digging into the graph module …

Got the PHPFina going after about three days, it showed only blank graphs

Found the cause which was using a 32 bit PHP engine on an older Pi 3 from when RPI only did 32 bit OS releases. The javascript was fine but PHP has a 32bit limit for int which is 2147483647 so it turned the start and end into the same time and produced an empty array. Solution is to change API.PHP

        $start = (int) $_GET['start'];
        $end = (int) $_GET['end'];

to

        $start = round($_GET['start']);
        $end = round($_GET['end']);

I will create a patch and pull request for it at some point and try my luck

Currently prioritising adding PHPTimeseries support, one step forward yesterday got the the file listing bit going

then the roof fell in :frowning: when I tried to get the data

I have managed to make some progress with tweaking Trystan’s PHPFina viewer to show PHPTimeseries data instead. So I can see what the graph drawing makes of raw data and get an understanding of how PHPTimeseries.php works without affecting my main emoncms installation

I have been using older versions of PHPTimeseries.php as they are simpler for me to understand. They have a csv_export and get_data rather than a get_data_combined function. I have managed to get it working with the PHPTimeseries.php from the SD image of July 2021 which is the last SD image before get_data_combined

After that I have changed the code to show the raw PHPTimeries points if there are less than 8928 actual points in the specified time range on the graph and to do the standard filtering if more than that

here is the standard behaviour for the last Day

here is the same data shown raw without trying to shoehorn it into a fixed interval

By using the raw data it will display two or more points that are very close to each other (less than the interval). I think that this is a good compromise which allows clumps of fast data (each point potentially separated by one second) interspersed with very long periods of inactivity (hours)

The zoom seems to work a lot better and the week and month views are vastly better

This does not use the steps display option, as PHPFina viewer only does line

I will have a go at porting the solution to the latest PHPTimeseries.php that the graph module utilises which uses get_data_combined

2 Likes

Nice work @SteveR interested to see what you come up with in terms of porting to PHPTimeseries

Here is my first attempt against Emoncms Core v11.4.11 from emonSD-01Feb24

Add it to PHPTimerSeries.php get_data_combined before line 366 while($time<=$end)

        //  find start and end positions, subtract to get number of points
		$startpos = @$this->binarysearch($fh,$start,$npoints);
        if (is_int($startpos)) { // found nothing
            $startpos = $npoints-1;
        } else {
            $startpos = $startpos[0]; 
        }	
        $endpos = @$this->binarysearch($fh,$end,$npoints);
        if (is_int($endpos)) {
            $endpos = $npoints-1;
        } else {
            $endpos = $endpos[0]; 
        }	
        //print print_r($startpos,true)."<br>".print_r($endpos, true)."<br>";
		$numpoints = $endpos-$startpos;
        //$numpoints = 8928; // uncomment to use fixed interval
        // if $numpoints lt 8928 then return them by sequential read
        if ($numpoints < 8928) {
            $this->log->info("Variable interval: File Start: ".$startpos." End: ".$endpos." Points: ".$numpoints."\r\n");		
            fseek($fh,$startpos*9);
            for ($i=0; $i<$numpoints; $i++) {
                $d = fread($fh,9);
                $array = @unpack("x/Itime/fvalue",$d);
                $timestamp = $array['time'];
                $value = $array['value'];
                if ($time>=$start && $time<=$end) {
                    //$this->log->info(" ".$timestamp." ".$value."\r\n");
                    if ($csv) {
                        $helperclass->csv_write($timestamp,$value);
                    } else {
                        $data[] = array($timestamp,$value);
                    }
                }
		    }
            $time = $end + 1; // bypass interval based method
            //$this->log->info("raw ".print_r($data, true)."\r\n");
        } else {
            $this->log->info("Fixed interval:\r\n");			
		}

It doesn’t do intervals or average at the moment

If you uncomment
//$numpoints = 8928; // uncomment to use fixed interval

then you can skip new code and see what the fixed interval code would do with the same data

If you thinks its worth having then will need to discuss the best way to slot the code in and I will issue a pull request

I made a few comments about what the changes were capable of displaying and have since checked them with some test harness data

To test it I produced a script to create a test thermostat trace which allows you to set

  • On/off timing like a normal heating controller
  • How many days of trace you want
  • Specify the edge interval
  • Halve the number of point by using the Step type to display it

It will display at a rate of 4 points per day, a step edge of 1 second

it might be useful for future testing

# creates a test PHPTimeSeries database

import sys, time, struct, os, datetime
id = "dummy"

def thermostat(fh): # creates thermostat settings for totaltime (weeks) with daily settings from timer
    timer = [['9:45',16],['10:30',7],['18:00',16],['21:30',7]] # 
    totaltime = 2 # weeks
    edge = 1 # edge duration in seconds
    steps = False # if True graph will be viewed using steps Type so less points needed

    now=int(time.time())
    tzcomp = int(time.mktime(datetime.datetime(1970, 1, 1, 0, 0).timetuple()))
    print("Local time to UTC {}s".format(tzcomp))	
    now = now - tzcomp
    seconds_in_day = 24 * 60 * 60  # 86400
    start_of_day = ((round(now) // seconds_in_day) * seconds_in_day)
    totaltime = totaltime * 7 * seconds_in_day
    stime = start_of_day - totaltime
    print("Start {}".format(time.strftime("%Y-%m-%d %H:%M:%S",time.gmtime(stime))))
    print("End   {}".format(time.strftime("%Y-%m-%d %H:%M:%S",time.gmtime(now))))

    lastval = timer[-1][1]	
    while (stime < now):
        for x in timer:
            t_time = x[0].split(":")
            tstamp = stime + int(t_time[0])*3600 + int(t_time[1])*60
            val = x[1]
            if tstamp < now:
                print("{} {} {}".format(time.strftime("%Y-%m-%d %H:%M:%S",time.gmtime(tstamp)),tstamp,val))
                if steps:
                    fh.write(struct.pack('<xIf',tstamp,val))
                else:
                    fh.write(struct.pack('<xIf',tstamp,lastval))
                    fh.write(struct.pack('<xIf',tstamp + edge,val))
            lastval = val
        stime = stime + seconds_in_day
        #stime = now		

fh = open("feed_"+id+".MYD",'wb')
thermostat(fh) # create set of test thermostat settings 
fh.close()