Indeed, this will have an impact on the overall property heat loss and system design, but along with internal system flow temperature etc, the main external influence on the actual ASHP performance is outside temperature - and humidity especially around defrost cycles.
We can add an additional field to see the mean outside temperatures, but was wondering if that, and maybe Carnot % would be useful as part of the default view?…but I guess there is a limit to practical number of columns on the landing page!
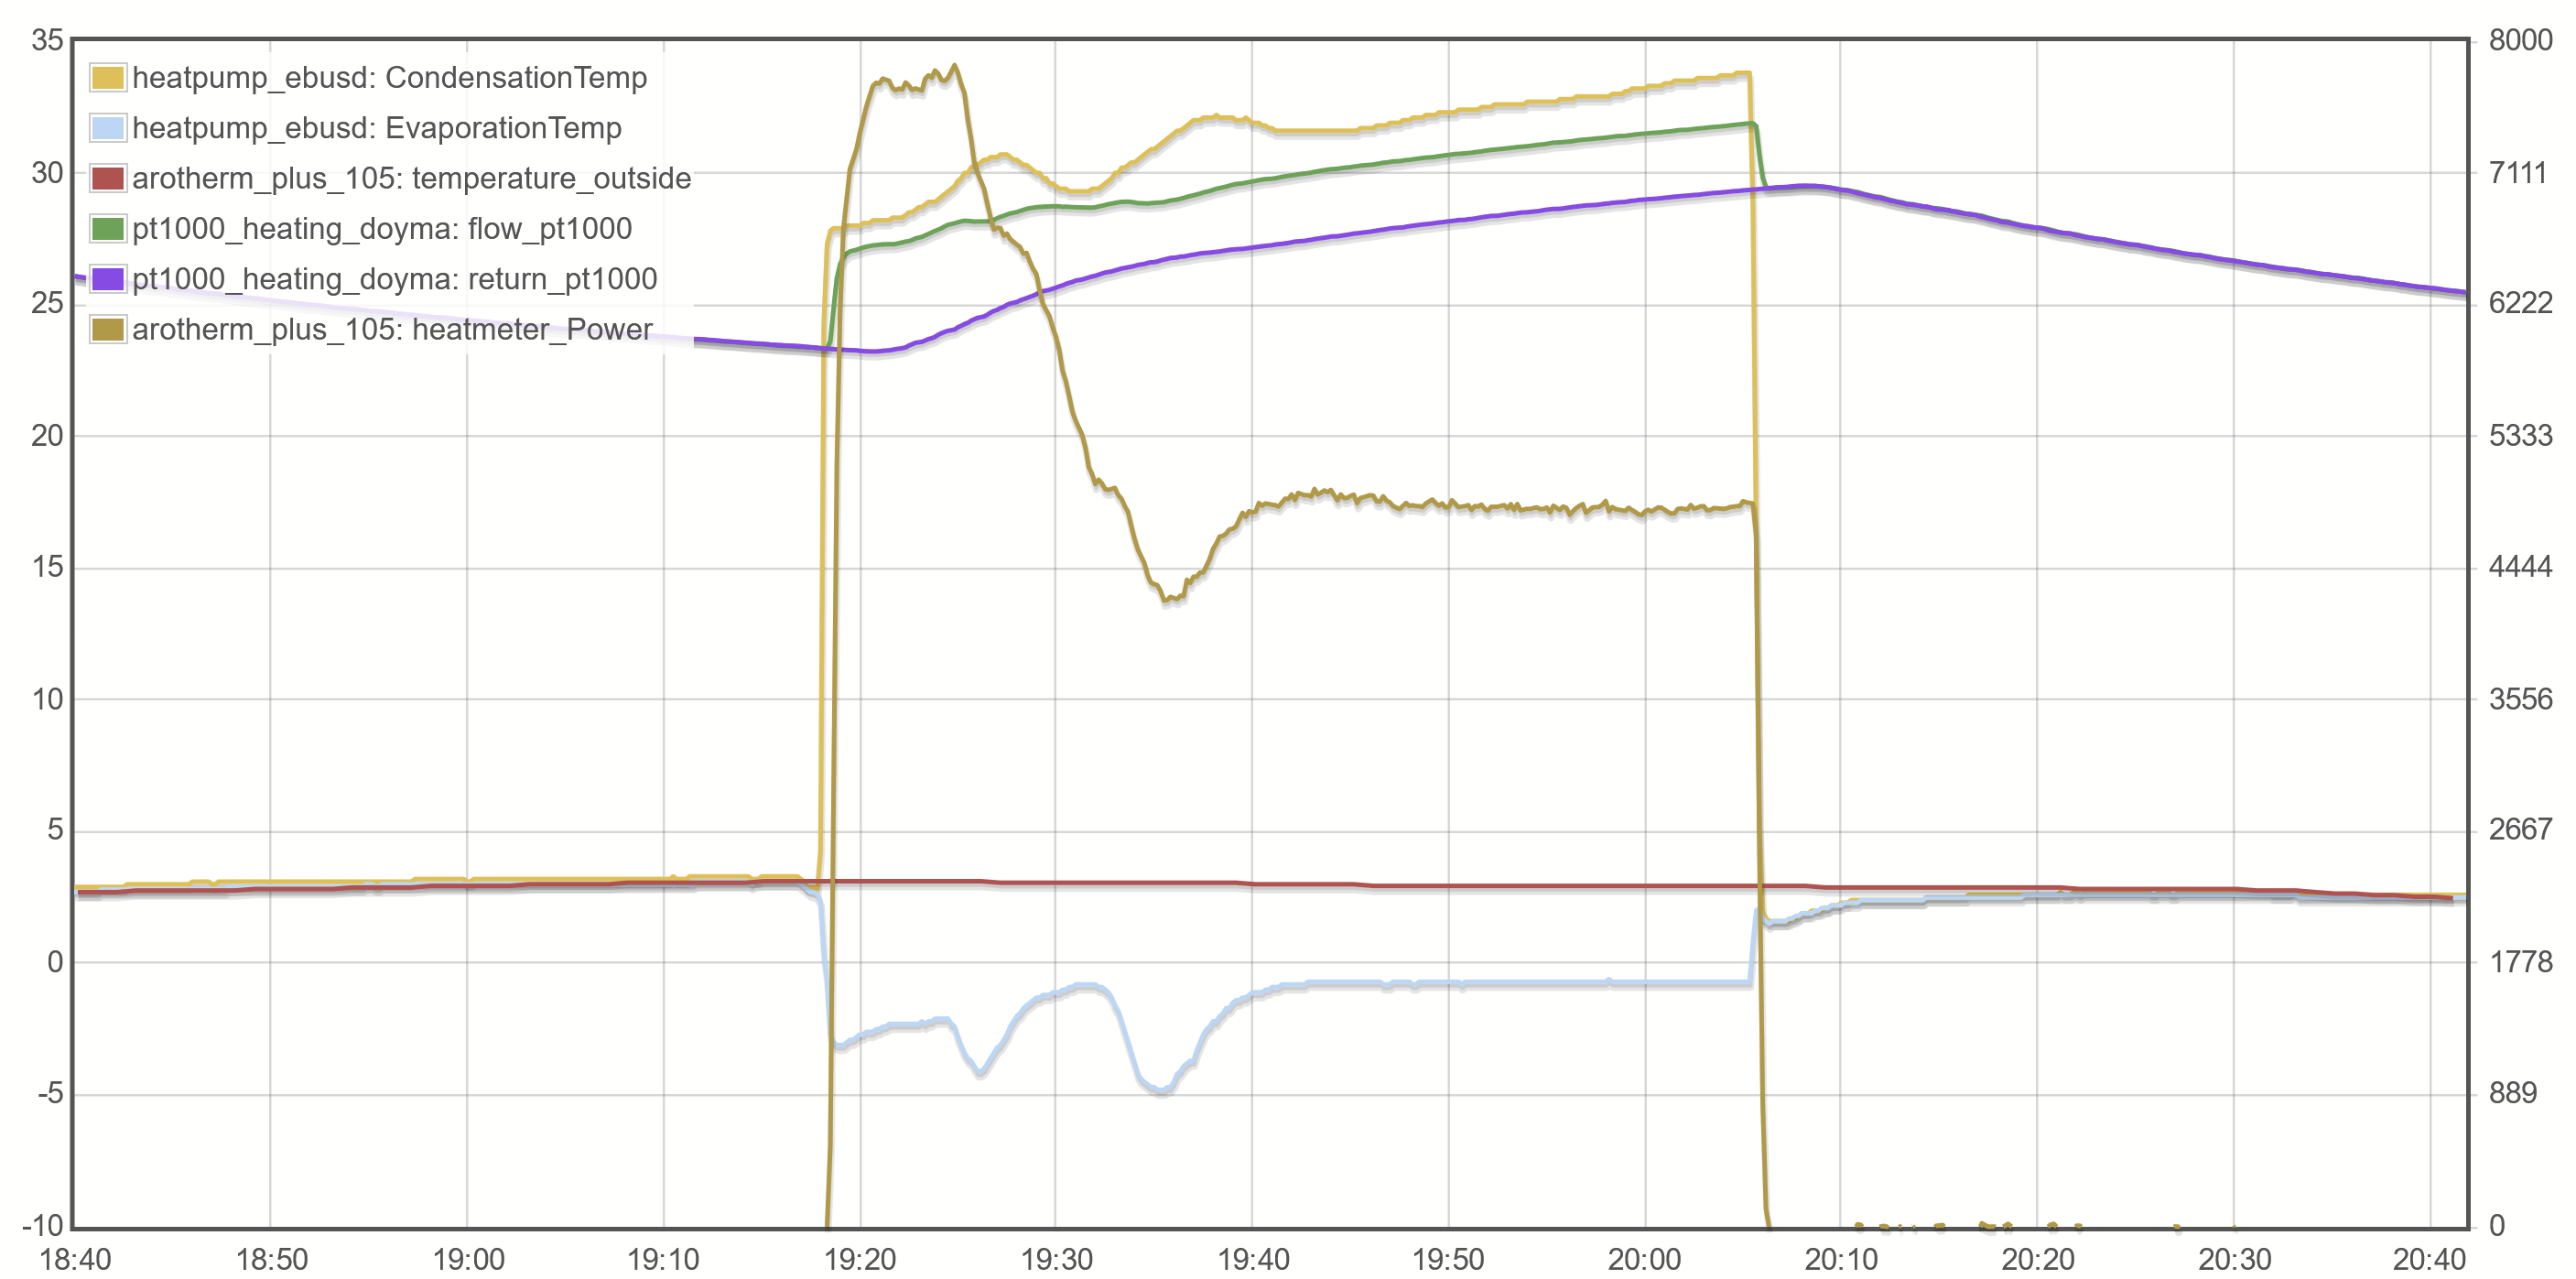
Some people have monitoring where they can see the actual evaporation/condensation temperatures (e.g. Vaillant ebus, unsure about other manufacturers) - I think it would be great to allow using those measurements for the Carnot efficiency calculation instead of the fixed offsets. This could be simply two feeds that if specified are used for the Carnot efficiency calculation, if they are left blank, the default offsets are used. For example, I’m getting this:
With the usual Vaillant sensor shenanigans, I shifted evaporation/condensation temperatures by -0.5K and +1K so they collapse to the same temperature (=outside temperature) between cycles. As can be seen there’s quite some transient behaviour in the beginning. Condensation goes toward +2K of flow temperature as the cycle stabilizes, the evaporation temperature is around 3.7K lower than ambient.
Hi @TrystanLea/@glyn.hudson just wondering if there is any progress on this QoL feature? Even when set to 5 points, my COP line looks like this due to the compressor frequency inceasing and decreasing regularly.