I recently moved some hardware/code from my old server (which was sending data to emoncms,org) to my Pi (running EmonSD, but still sending data to emoncms.org). The hardware is PIC based module with 10 x DS18B20 temperature sensors that dumps the data over USB serial.
I’ve written a NodeRed flow that accepts this data, strips out the XML type stuff and forwards the data to emoncms.org (and also now logs to a flat file on a USB flash drive in the Pi). The data is fine on all the channels apart from the first, where every so often there is 10+'C dip in the temperature.
I thought this was an error in the flow, but it looks OK, so I wrote the data to a log file file and that’s OK too. Just now I happened to be tinkering with NR and noticed another glitch, but the data that was going to the emoncms send node seems correct. So now I’m a bit lost as to what’s happening. Any ideas?
As an aside, when I hover on the data viewer lines, I get data like 18.55999465942’C rather than 18.56’C which seems odd.
Many thanks in advance!
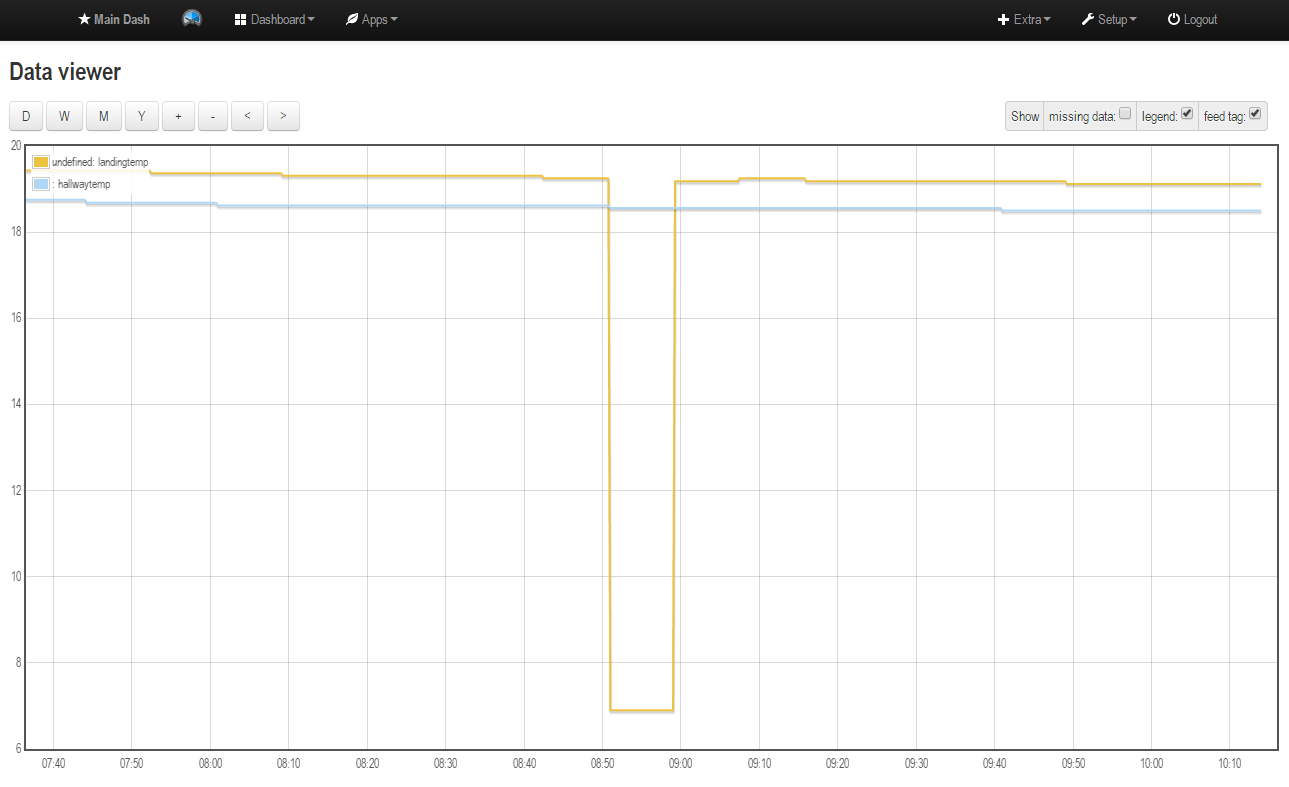
Here’s the graph -
And the data {“t0”:“19.25”,“t1”:“18.62”,“t2”:“6.31”,“t3”:“0”,“t4”:“5.81”,“t5”:“22.43”,“t6”:“23.81”,“t7”:“0”,“t8”:“24.06”,“t9”:“0”}
{“t0”:“19.25”,“t1”:“18.62”,“t2”:“6.68”,“t3”:“0”,“t4”:“5.93”,“t5”:“22.50”,“t6”:“23.81”,“t7”:“0”,“t8”:“24.06”,“t9”:“0”}
{“t0”:“19.25”,“t1”:“18.56”,“t2”:“7.06”,“t3”:“0”,“t4”:“6.00”,“t5”:“22.50”,“t6”:“23.81”,“t7”:“0”,“t8”:“24.00”,“t9”:“0”}
{“t0”:“19.25”,“t1”:“18.56”,“t2”:“7.50”,“t3”:“0”,“t4”:“6.50”,“t5”:“22.50”,“t6”:“23.81”,“t7”:“0”,“t8”:“24.06”,“t9”:“0”}
{“t0”:“19.18”,“t1”:“18.56”,“t2”:“7.81”,“t3”:“0”,“t4”:“6.68”,“t5”:“22.56”,“t6”:“23.75”,“t7”:“0”,“t8”:“24.00”,“t9”:“0”}
{“t0”:“19.25”,“t1”:“18.56”,“t2”:“8.12”,“t3”:“0”,“t4”:“6.87”,“t5”:“22.50”,“t6”:“23.75”,“t7”:“0”,“t8”:“24.00”,“t9”:“0”}
{“t0”:“19.18”,“t1”:“18.56”,“t2”:“8.50”,“t3”:“0”,“t4”:“7.00”,“t5”:“22.43”,“t6”:“23.75”,“t7”:“0”,“t8”:“23.93”,“t9”:“0”}
{“t0”:“19.18”,“t1”:“18.56”,“t2”:“8.81”,“t3”:“0”,“t4”:“7.18”,“t5”:“22.43”,“t6”:“23.75”,“t7”:“0”,“t8”:“24.00”,“t9”:“0”}
{“t0”:“19.18”,“t1”:“18.56”,“t2”:“9.12”,“t3”:“0”,“t4”:“7.37”,“t5”:“22.56”,“t6”:“23.75”,“t7”:“0”,“t8”:“24.00”,“t9”:“0”}
{“t0”:“19.18”,“t1”:“18.56”,“t2”:“9.56”,“t3”:“0”,“t4”:“7.50”,“t5”:“22.50”,“t6”:“23.68”,“t7”:“0”,“t8”:“23.93”,“t9”:“0”}
{“t0”:“19.18”,“t1”:“18.56”,“t2”:“10.06”,“t3”:“0”,“t4”:“7.93”,“t5”:“22.50”,“t6”:“23.68”,“t7”:“0”,“t8”:“23.93”,“t9”:“0”}
{“t0”:“19.18”,“t1”:“18.56”,“t2”:“10.31”,“t3”:“0”,“t4”:“8.06”,“t5”:“22.31”,“t6”:“23.68”,“t7”:“0”,“t8”:“23.93”,“t9”:“0”}
{“t0”:“19.18”,“t1”:“18.50”,“t2”:“10.75”,“t3”:“0”,“t4”:“8.31”,“t5”:“22.50”,“t6”:“23.68”,“t7”:“0”,“t8”:“23.93”,“t9”:“0”}
{“t0”:“19.12”,“t1”:“18.50”,“t2”:“11.12”,“t3”:“0”,“t4”:“8.37”,“t5”:“22.50”,“t6”:“23.68”,“t7”:“0”,“t8”:“23.93”,“t9”:“0”}
{“t0”:“19.12”,“t1”:“18.50”,“t2”:“11.43”,“t3”:“0”,“t4”:“8.50”,“t5”:“22.43”,“t6”:“23.68”,“t7”:“0”,“t8”:“23.87”,“t9”:“0”}
{“t0”:“19.12”,“t1”:“18.50”,“t2”:“11.81”,“t3”:“0”,“t4”:“8.81”,“t5”:“22.50”,“t6”:“23.68”,“t7”:“0”,“t8”:“23.93”,“t9”:“0”}
{“t0”:“19.12”,“t1”:“18.50”,“t2”:“12.18”,“t3”:“0”,“t4”:“8.87”,“t5”:“22.50”,“t6”:“23.68”,“t7”:“0”,“t8”:“23.93”,“t9”:“0”}
{“t0”:“19.06”,“t1”:“18.50”,“t2”:“12.37”,“t3”:“0”,“t4”:“9.00”,“t5”:“22.50”,“t6”:“23.68”,“t7”:“0”,“t8”:“23.93”,“t9”:“0”}
{“t0”:“19.06”,“t1”:“18.50”,“t2”:“12.68”,“t3”:“0”,“t4”:“9.25”,“t5”:“22.43”,“t6”:“23.68”,“t7”:“0”,“t8”:“23.87”,“t9”:“0”}
t0 is the landing temperature.