I’ve added a guide to using the Octopus Agile app to the OpenEnergyMonitor guide site here Octopus Agile - Guide | OpenEnergyMonitor hopefully a better place for new users to read through to find out about the app. Let me know if there are parts that would be good to expand on.
Trying to set up this app for a friend and although initally it looked to be working after I tweaked the feeds I can now no longer get a sensible looking graph:
Thanks for the documentation Trystan - apologies for not replying straight away. I have 3 feeds, the usual 2 and one on the divert, so I’ll have to do some fancy addition or subtraction to get the feeds used in the app to have the right values.
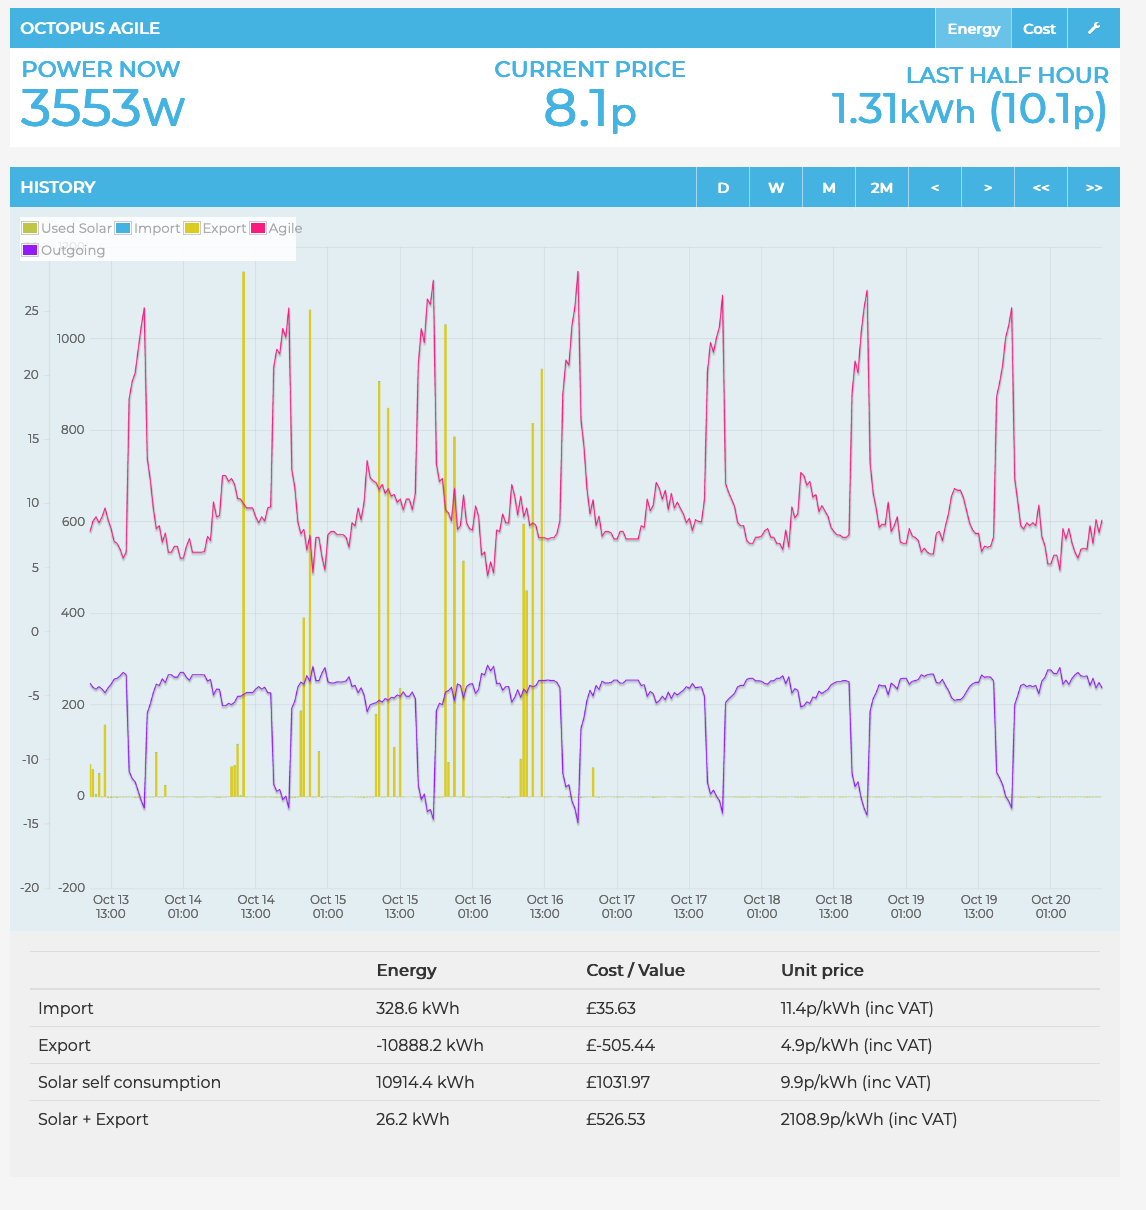
EDIT: Having (I think) sorted my feeds out I was surprised when I checked the graph, the data didn’t seem to be in the right place against the tariff lines.
Looking to the axes on the left, the 0’s aren’t aligned, so my kwh data is up one from where the tariffs are dsiplayed - is this just because the my data has only just started - so to speak - or is this intentional. I would have thought that both axes should be aligned on their 0 points?
@markb I’ve hopefully fixed the configuration issue where selecting different feeds doesnt appear to change the graph. If you pull in the latest update there it should work.
You are right that they dont line up at zero at the moment, I did try and fix that but could not quite get it to look right, the y axis is autoscaled by the graphing library at the moment.
Hi Trystan, thought as much! Would be good if this doesn’t drop down the list of things to fix if possible - it might put a new user off. Having said that it’s a great addition to the apps - thanks for setting it up.
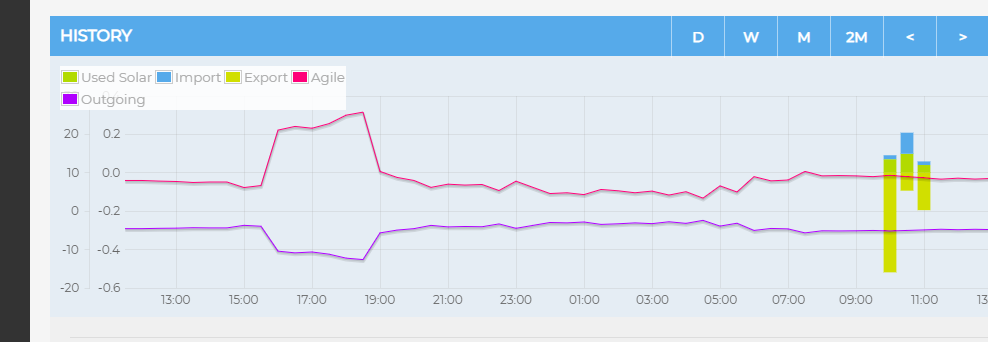
EDIT: They are now lined up of course since there’s more data I guess.
Hi, I am having a another run at OpenEnergyMonitor through emonpi. Steep learning curve!
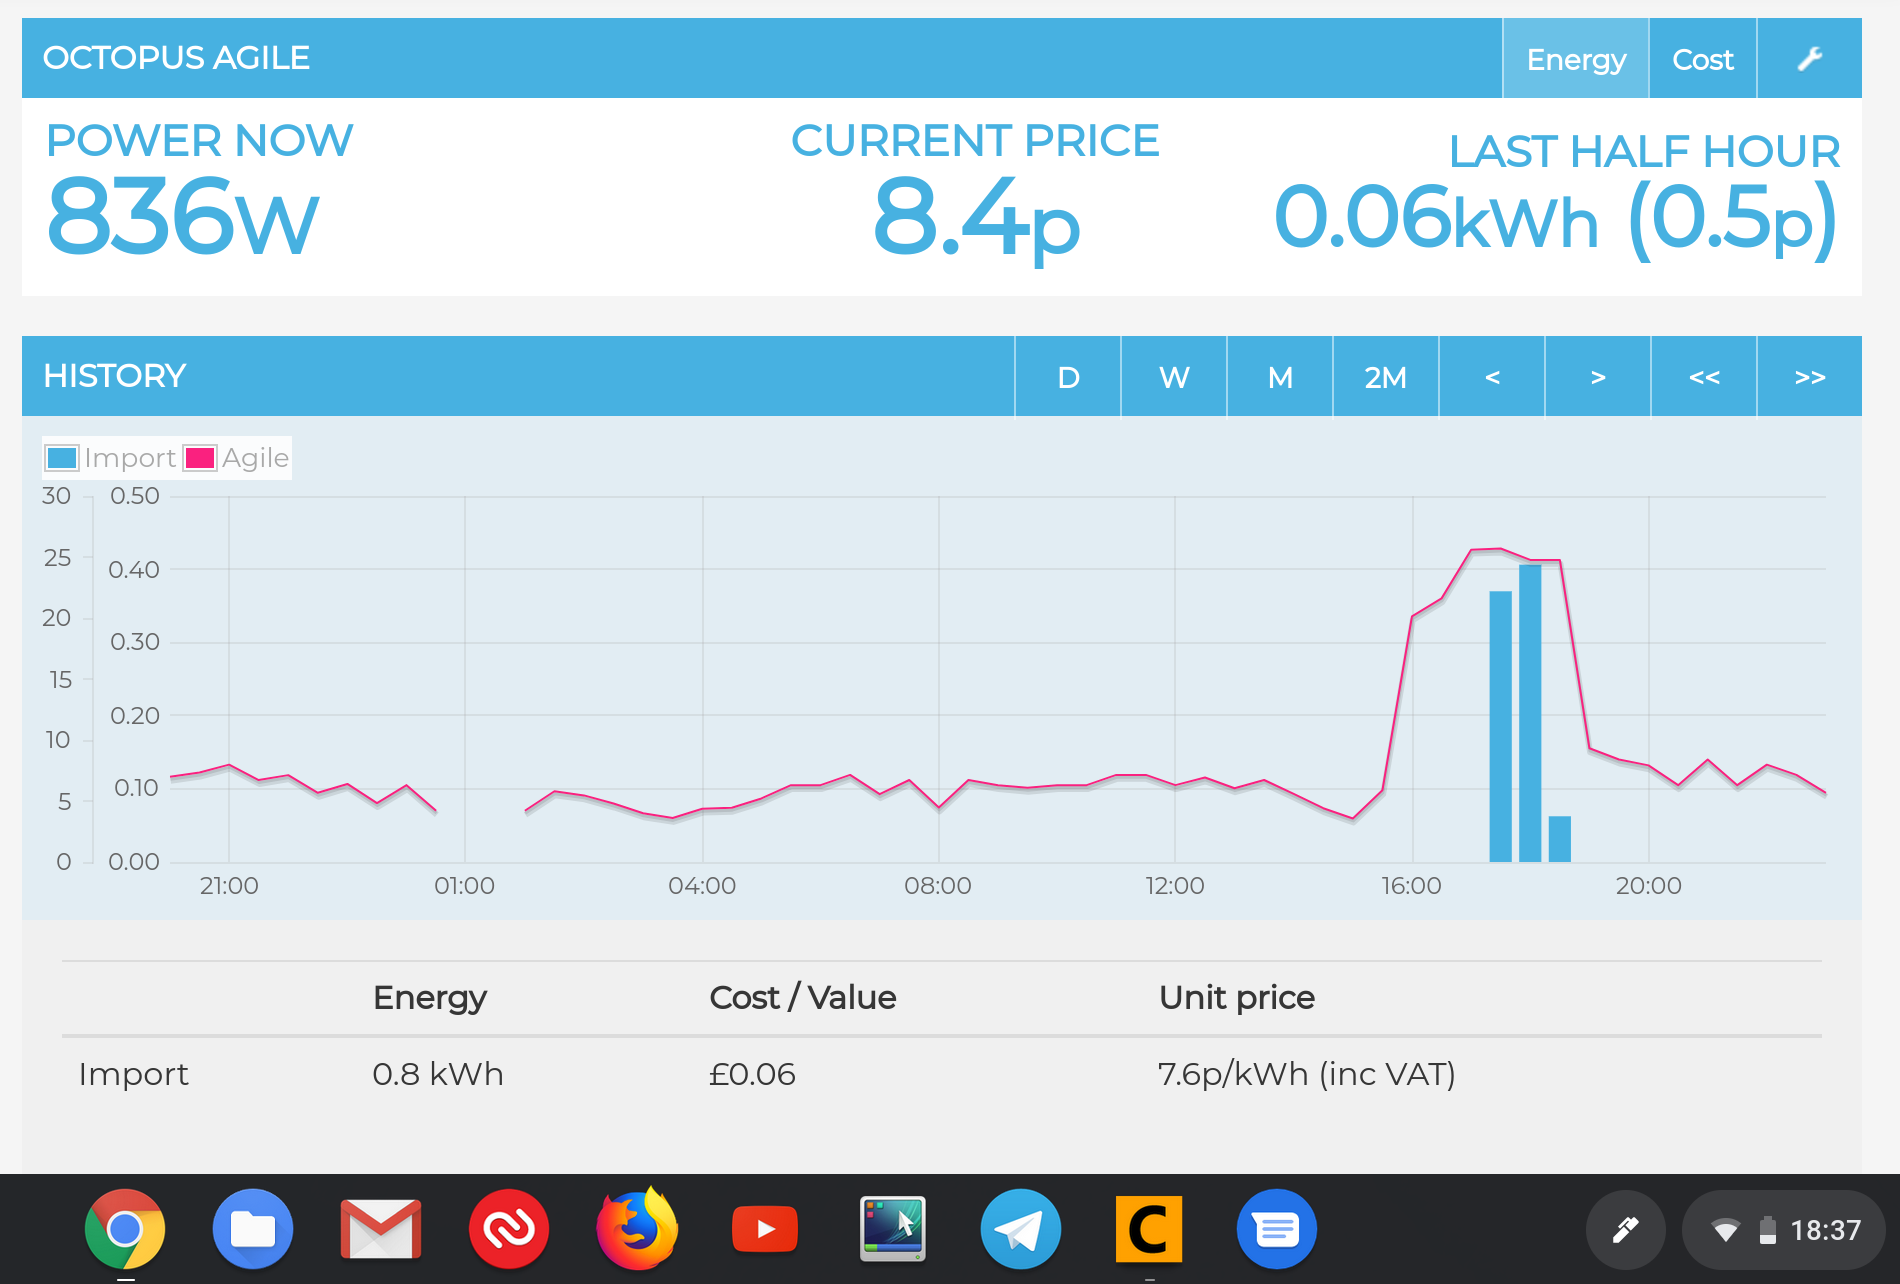
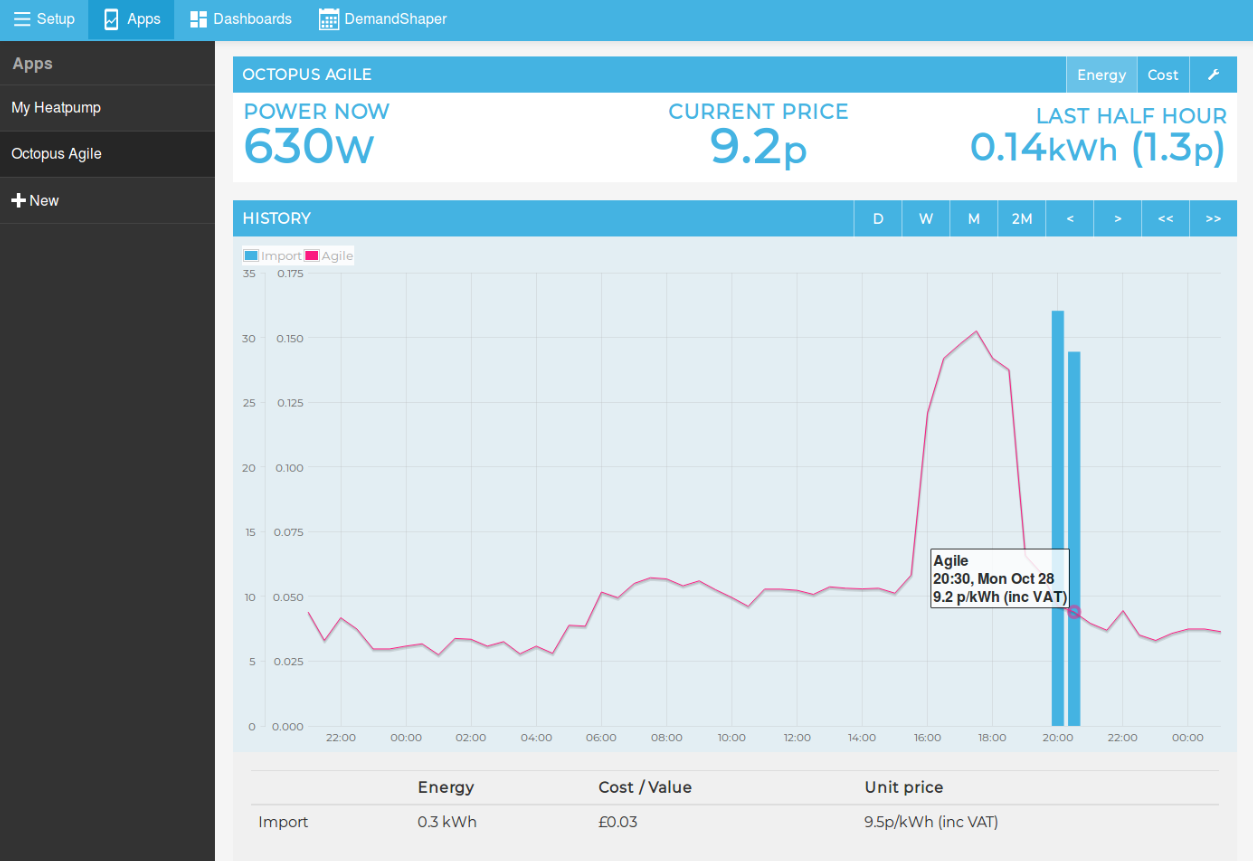
But I am on Octopus Agile and delighted to see you have made this App. It appears to be working fine, but the “Current Price” in the middle is not what I expect. You can see from the image that it is 6:34pm here right now and the rate should be 26.0p (the graph shows this correctly, so it has collected the correct data). Am I missing something in that central number? Is it something like the rate at which I am spending money or something?
I have checked the time on the pi and it is correct.
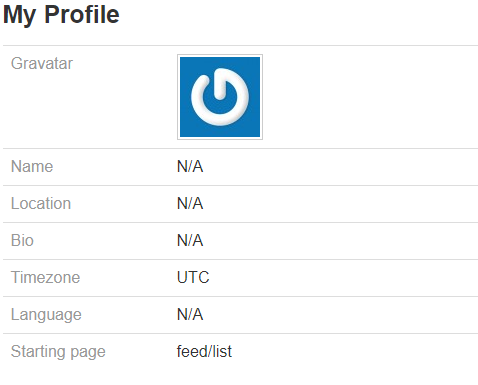
What time zone are you in and have you set that in the user profile? Top right, under myaccount - mouse over the timezone section and you will see the pencil, click on that and select the right timezone.
You will need to wait for @TrystanLea to help. I am not sure where the ‘current’ figure comes from. As I understand it, the data is downloaded every 24Hrs so I’m not sure if this is a predicted figure.
On the Octopus website, can you see a ‘current’ figure. There is nothing obvious to a non-customer.
It will come directly from Octopus via their API. I actually use that to calculate my daily spend in arrears.
It could be that I’m a bit ‘previous’ and once I’ve got a few hours/days of data it will settle down. I just love the idea of displaying the current spend rate to myself and my family.
FWIW, it is now (20:55) reporting 0.0p. I wonder if it will sort itself out after 24h.
Later, it is now on 4.4p: it appears to be tracking along the rates from the start of the graph, not the current rate.
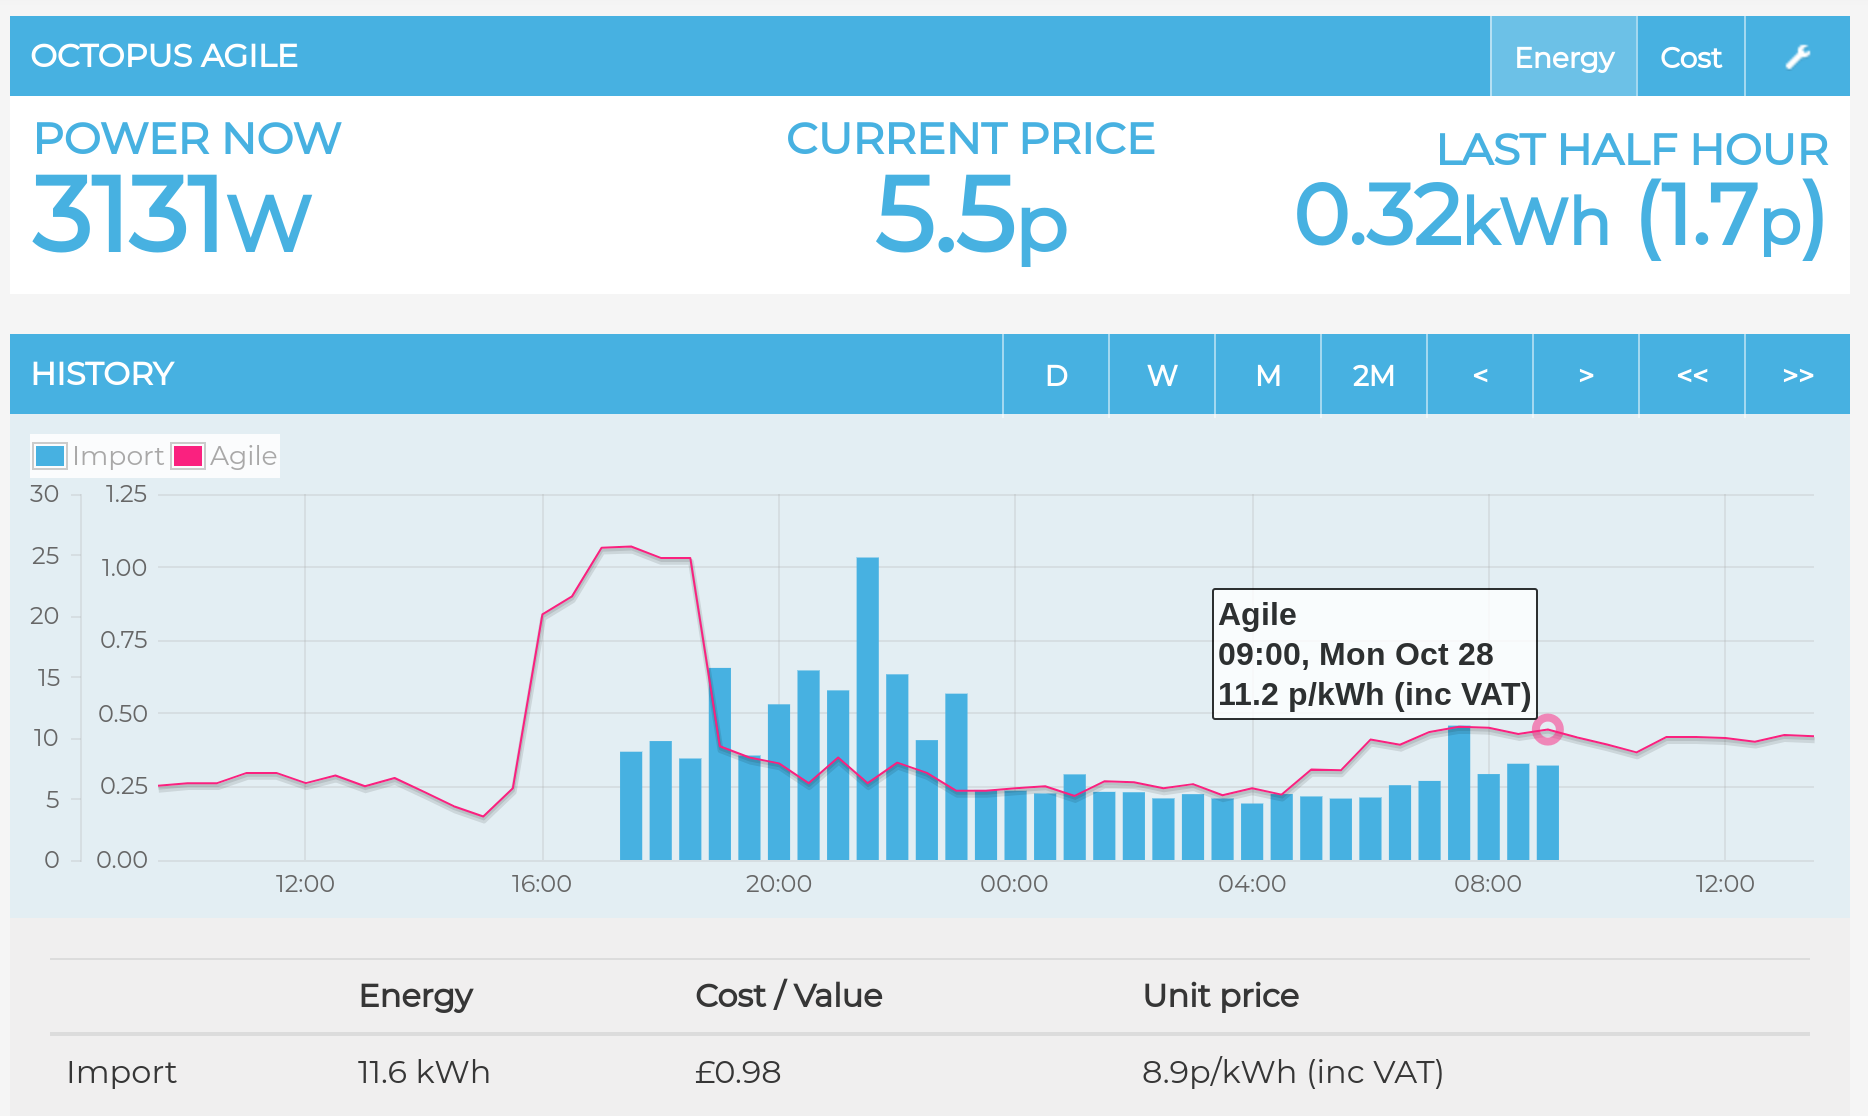
As a new user I am not allowed another reply! As of 9:24 this morning, it is still lagging along. The correct rate is on the graph, 5.5p was the 1am rate.
:
I have been running the app since it was released. I have just checked and I can confirm the current price is incorrect for some reason. It displays 12.6p.
Octopus dashboard shows 12.56p. It is not a late update as previous half hour was 12.08p.
I can see why. It looks like it doesn’t account for there being no import data at the start of the graph, so it will cause the selection of the price to be offset. So from the picture in your last graph it was missing about 15 values.
It’s stores the data in a few arrays and uses the length of the input array to pick the right value from the agile cost array, but as you are missing the values for the first few entries it picks the wrong item.
You have 32 bars, so it would have picked the current price value as the 32nd value from the agile series. (The 1am rate) instead of picking the 47th item which would have been the 9am one.
Now you have data for your entire view then it works fine.
thanks @Thomas28 and @mpcaddy for giving me a pointer as to what to look for!
I’ve changed the implementation, removed that part that changed the size of the arrays relative to each other if they had null values present, it now finds the index of the array that corresponds to the present half hour and displays the result. fix agile current price · emoncms/app@7a8eff7 · GitHub
Latest available in both master and stable branches of the apps module, can be updated via standard emonpi update.
I have the app working great with all 4 feeds for my grid connection with solar.
However I also have a second grid connection without solar and would therefore like to only use 2 feeds for this. The problem I have is that even if I don’t select the optional feeds they auto select from the other grid connection. I can partially mitigate this by setting the use_kwh to the same feed as import_kwh but I can’t find a way to deselect these optional feeds and therefore completely ignore the solar data from the other grid connection.