Ok, you won’t see anything on the Feeds page until you create a Feed. The Feed is the database, and it is created when you send data to it, and you do that on the Inputs page, as a step as you “process” the Input data. Until you do something with the incoming data NOTHING IS SAVED. It just sits there on the Inputs page and when the next tranche of data arrives, the ‘old’ data is overwritten and it’s gone forever.
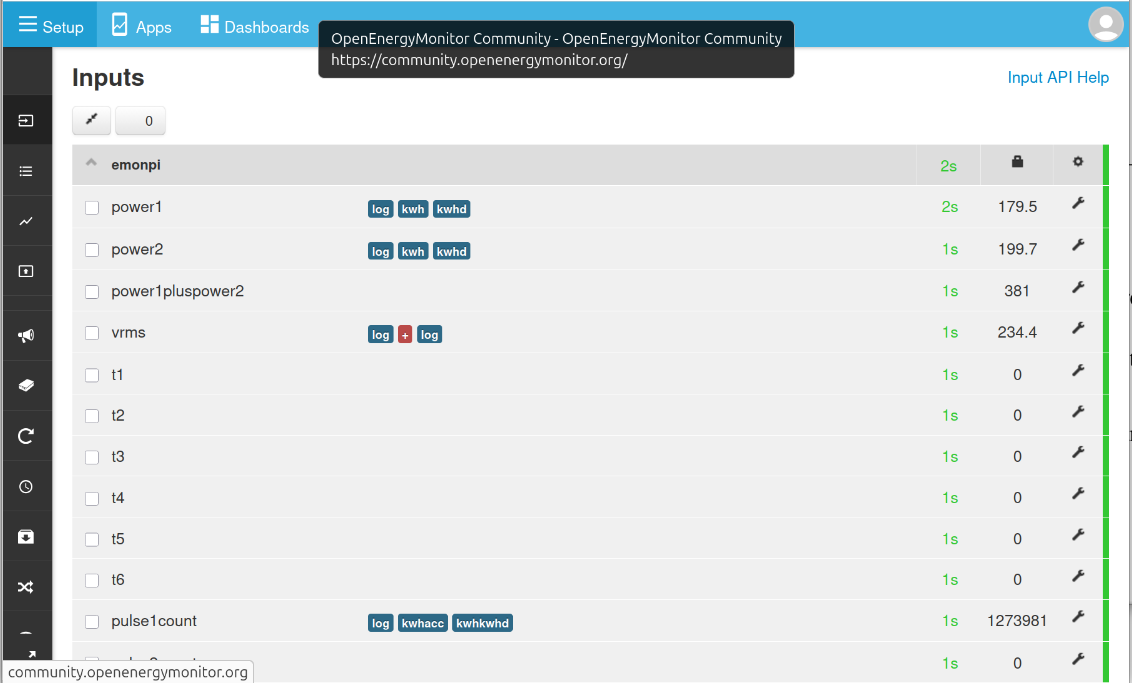
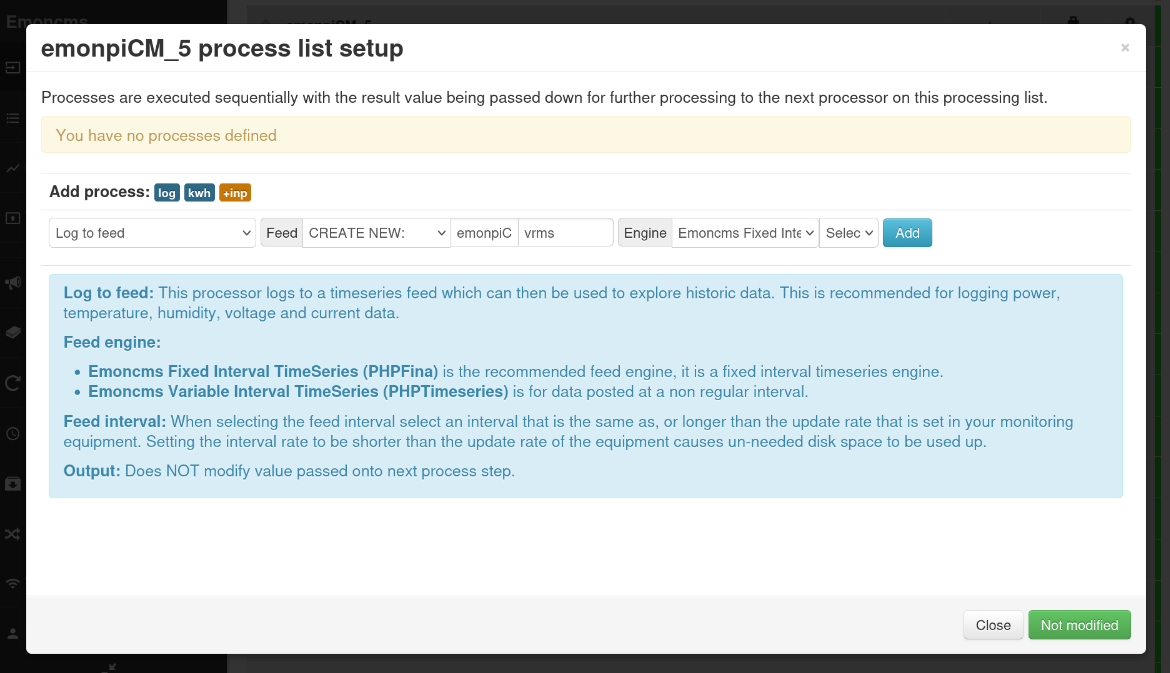
So go back to the Inputs page, and you’ll create a Feed to store the rms voltage. Click the spanner icon at the end of the Vrms line. You’ll see a page like this:
In the left-most box, the default is exactly what we want – “Log to feed”. If you expand the drop-down, you’ll see all the available processes. In the blue area below is an explanation of what the process does. Moving to the right, in the next box is CREATE NEW (we want a new feed because we know one to store Vrms doesn’t exist), and the next box tells where it came from, and the one after that is the name of the individual Feed. You can, and probably will want to, edit these names. For “Engine”, for this data that arrives regularly at fixed time intervals (9.8 s, I happen to know  ), choose “Emoncms Fixed Interval Timeseries” and for “Select Interval”, you must choose an interval longer than the interval for the data (otherwise, you get NULL values in the database that play havoc with the graphs). So choose 10s, longer if you wish, and click Add.
If you have finished with this Input, click ‘Changed press to save’ (bottom right).
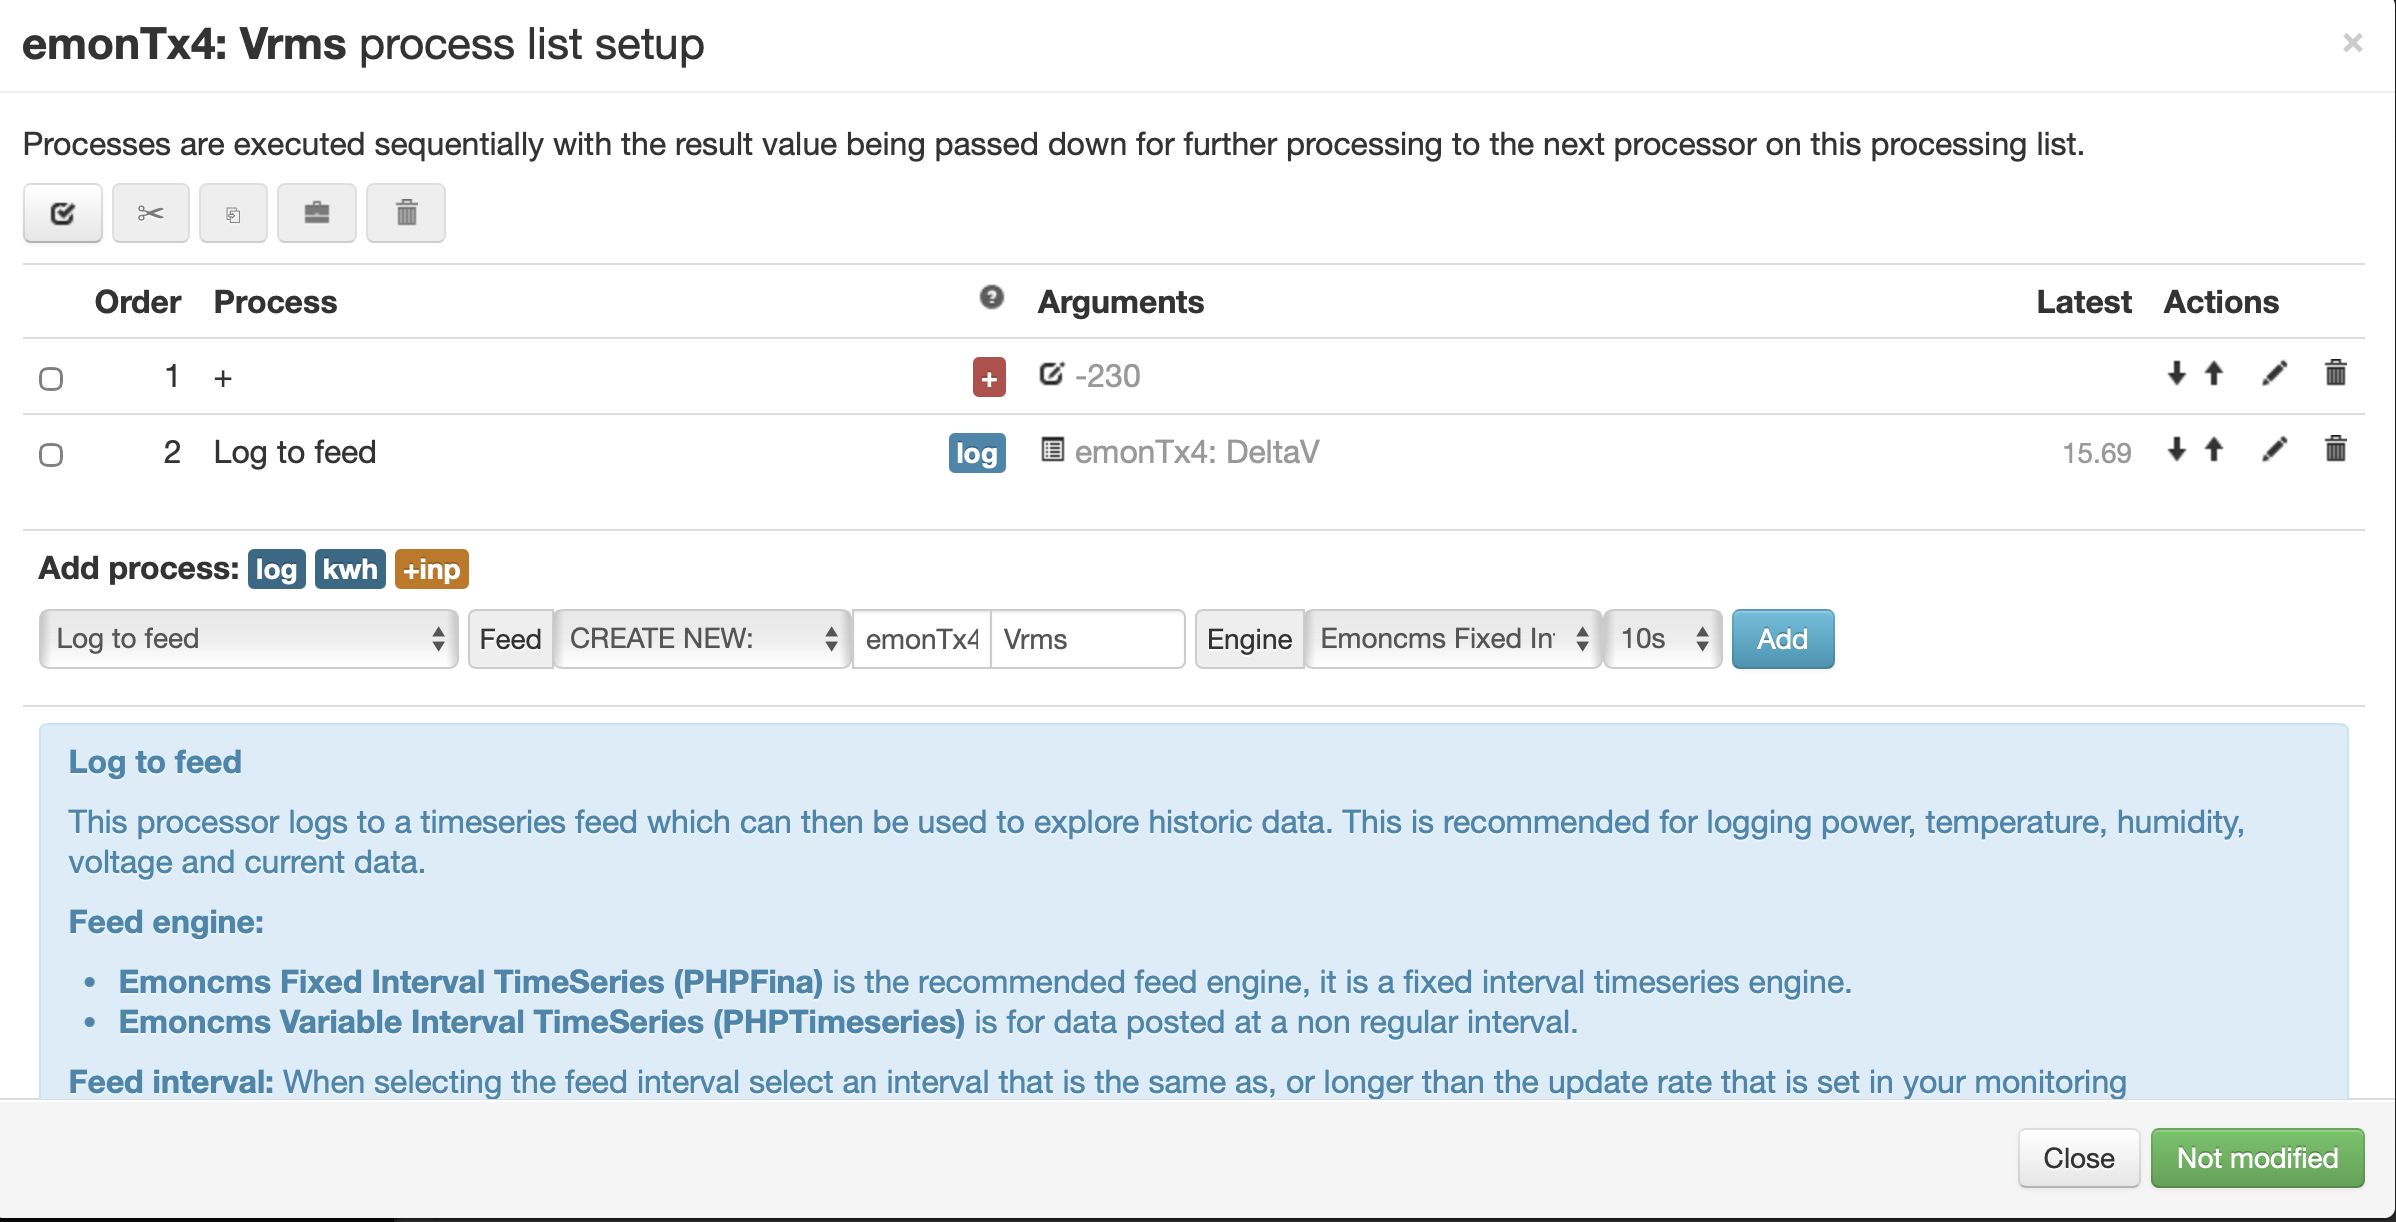
But for fun, we’ll add another Feed. We’ll call it DeltaV, and it will be the difference between the nominal 230 V and the actual voltage.
So, still editing processes for Vrms, expand the drop-down and under Calibration, select ‘+’.
In Value, type -230 (we add a negative value to subtract) and click Add.
Now Log to a new feed, exactly as above, but call it “DeltaV”.
Remember to click ‘Changed…’ bottom right before you leave the page. Click Close.
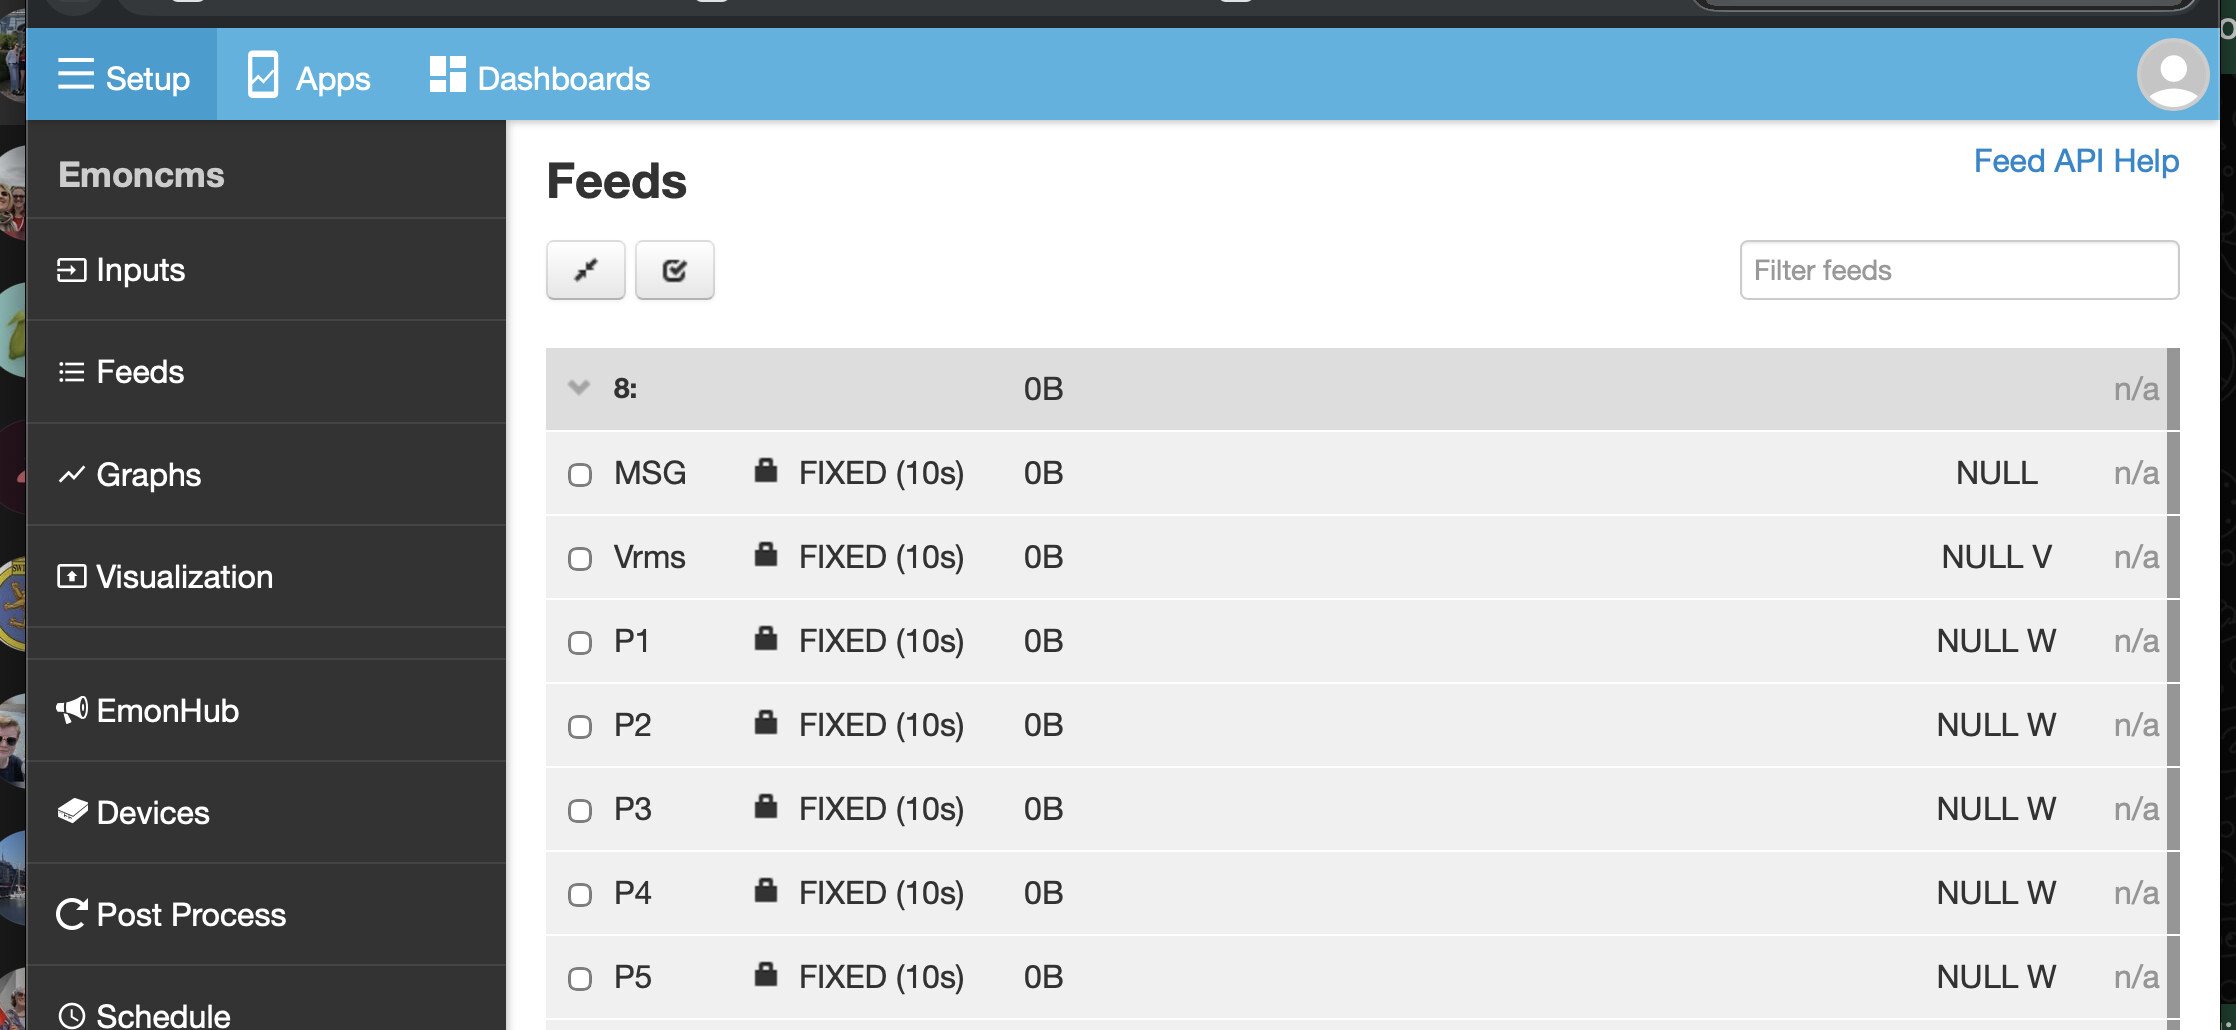
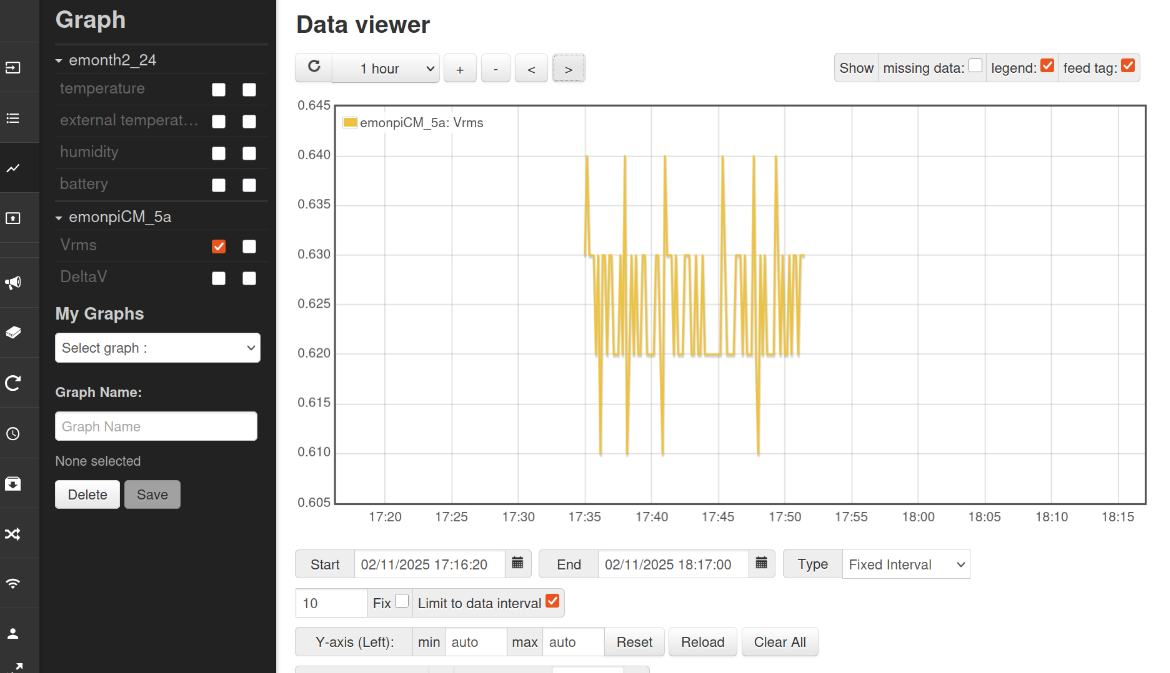
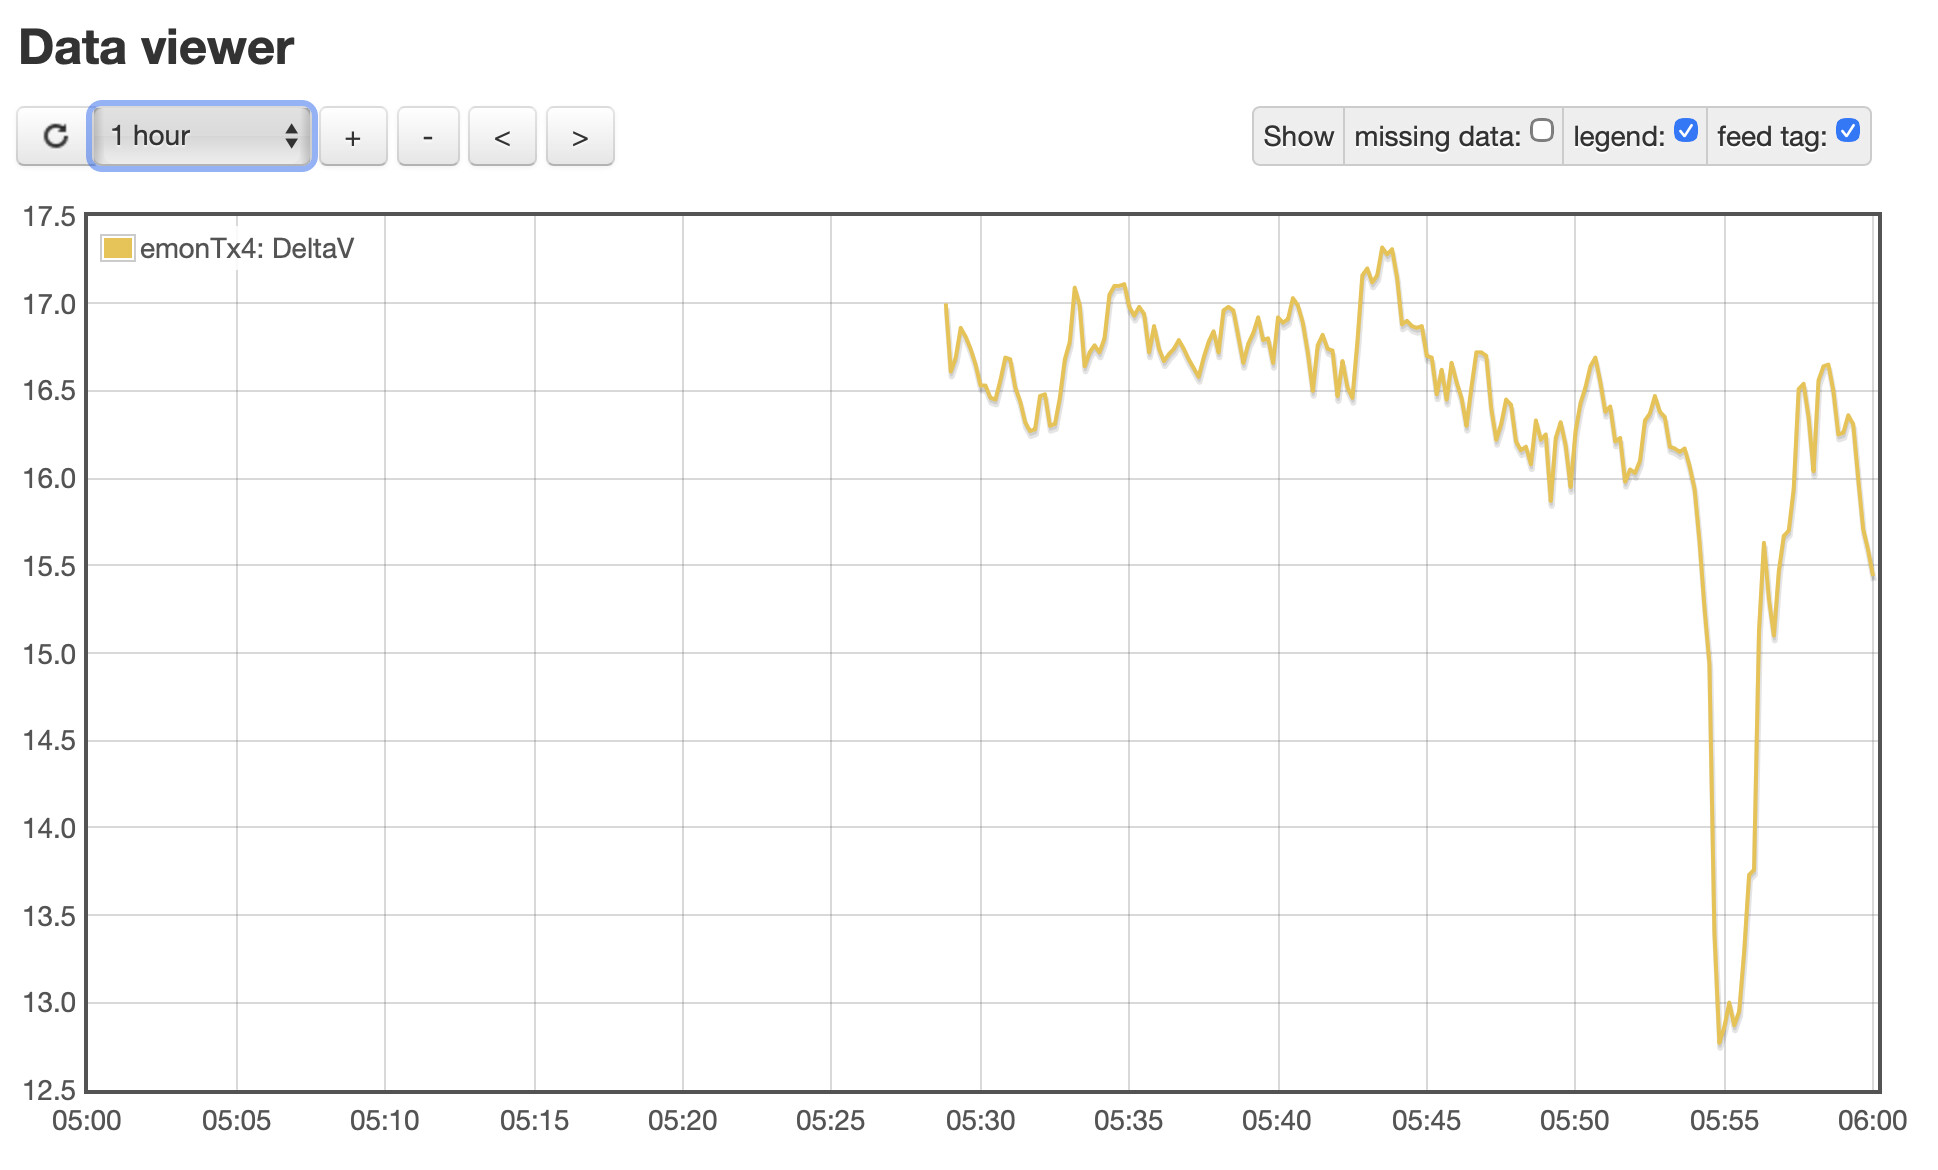
Now go to the Feeds page and you should see two (new) Feeds. Leave it for a few minutes, then click on the name of a Feed. This will open a time graph “Data Viewer” and if you play around with the line of boxes under ‘Data viewer’ to expand and position the viewing window over the data, you should see something a bit like this (OK, I don’t have a voltage connected to this emonPi!).
This has covered the basics of saving and conditioning the incoming data.
When you connect your emonTx4, the data Inputs should appear automatically, and you can handle the voltage (if you have a splitter on the “Ethernet-lookalike” from the emonVs) and everything else in the same way.
Let me know how you get on.