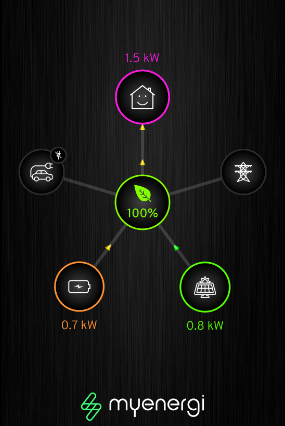
I’d like to make a more ‘flashy’ dashboard in the style of Tesla/MyEnergi with a moving display of where power is going like this -
Where the small yellow arrows are moving in the direction that power is flowing, in this case from the battery and the PV into the house, with nothing going to the EV or grid.
Designing the screen isn’t the issue, I can do the moving with some GIFs, the problem is swapping the GIFs to reverse the power flow or non-moving GIFs for no flow.
Is there any way of doing this currently? Or via another method I’ve missed?
Possibly. Take a look at ‘Learn’ and the 3-phase page. The rotating diagram there is SVG (Scalable Vector Graphics) - started in Inkscape and then with animation added with a text editor.
Hi @Robert.Wall It’s not really the animation that’s the issue (I’ve tried it with SVG’s too), it’s controlling it. i.e. a feed value is positive, show this GIF / use this HTML, if the value is negative, show that GIF / use this different HTML. That’s what I don’t know how to achieve.
Ah, I thought you meant moving elements to graphically show the direction.
You need to study Trystan’s notes on creating your own elements (I think they exist - I can’t remember where), or take apart one of the simpler elements (the Button?) to see how he did it.
Matt Galloway might also be able to help - I think he’s done some work on dashboards.
Also, searching for “new dashboard widget” will I think show who’s contributed new ones.