Negative real power with arduino uno + emonTX shield - 3 phase power supply

Hello,
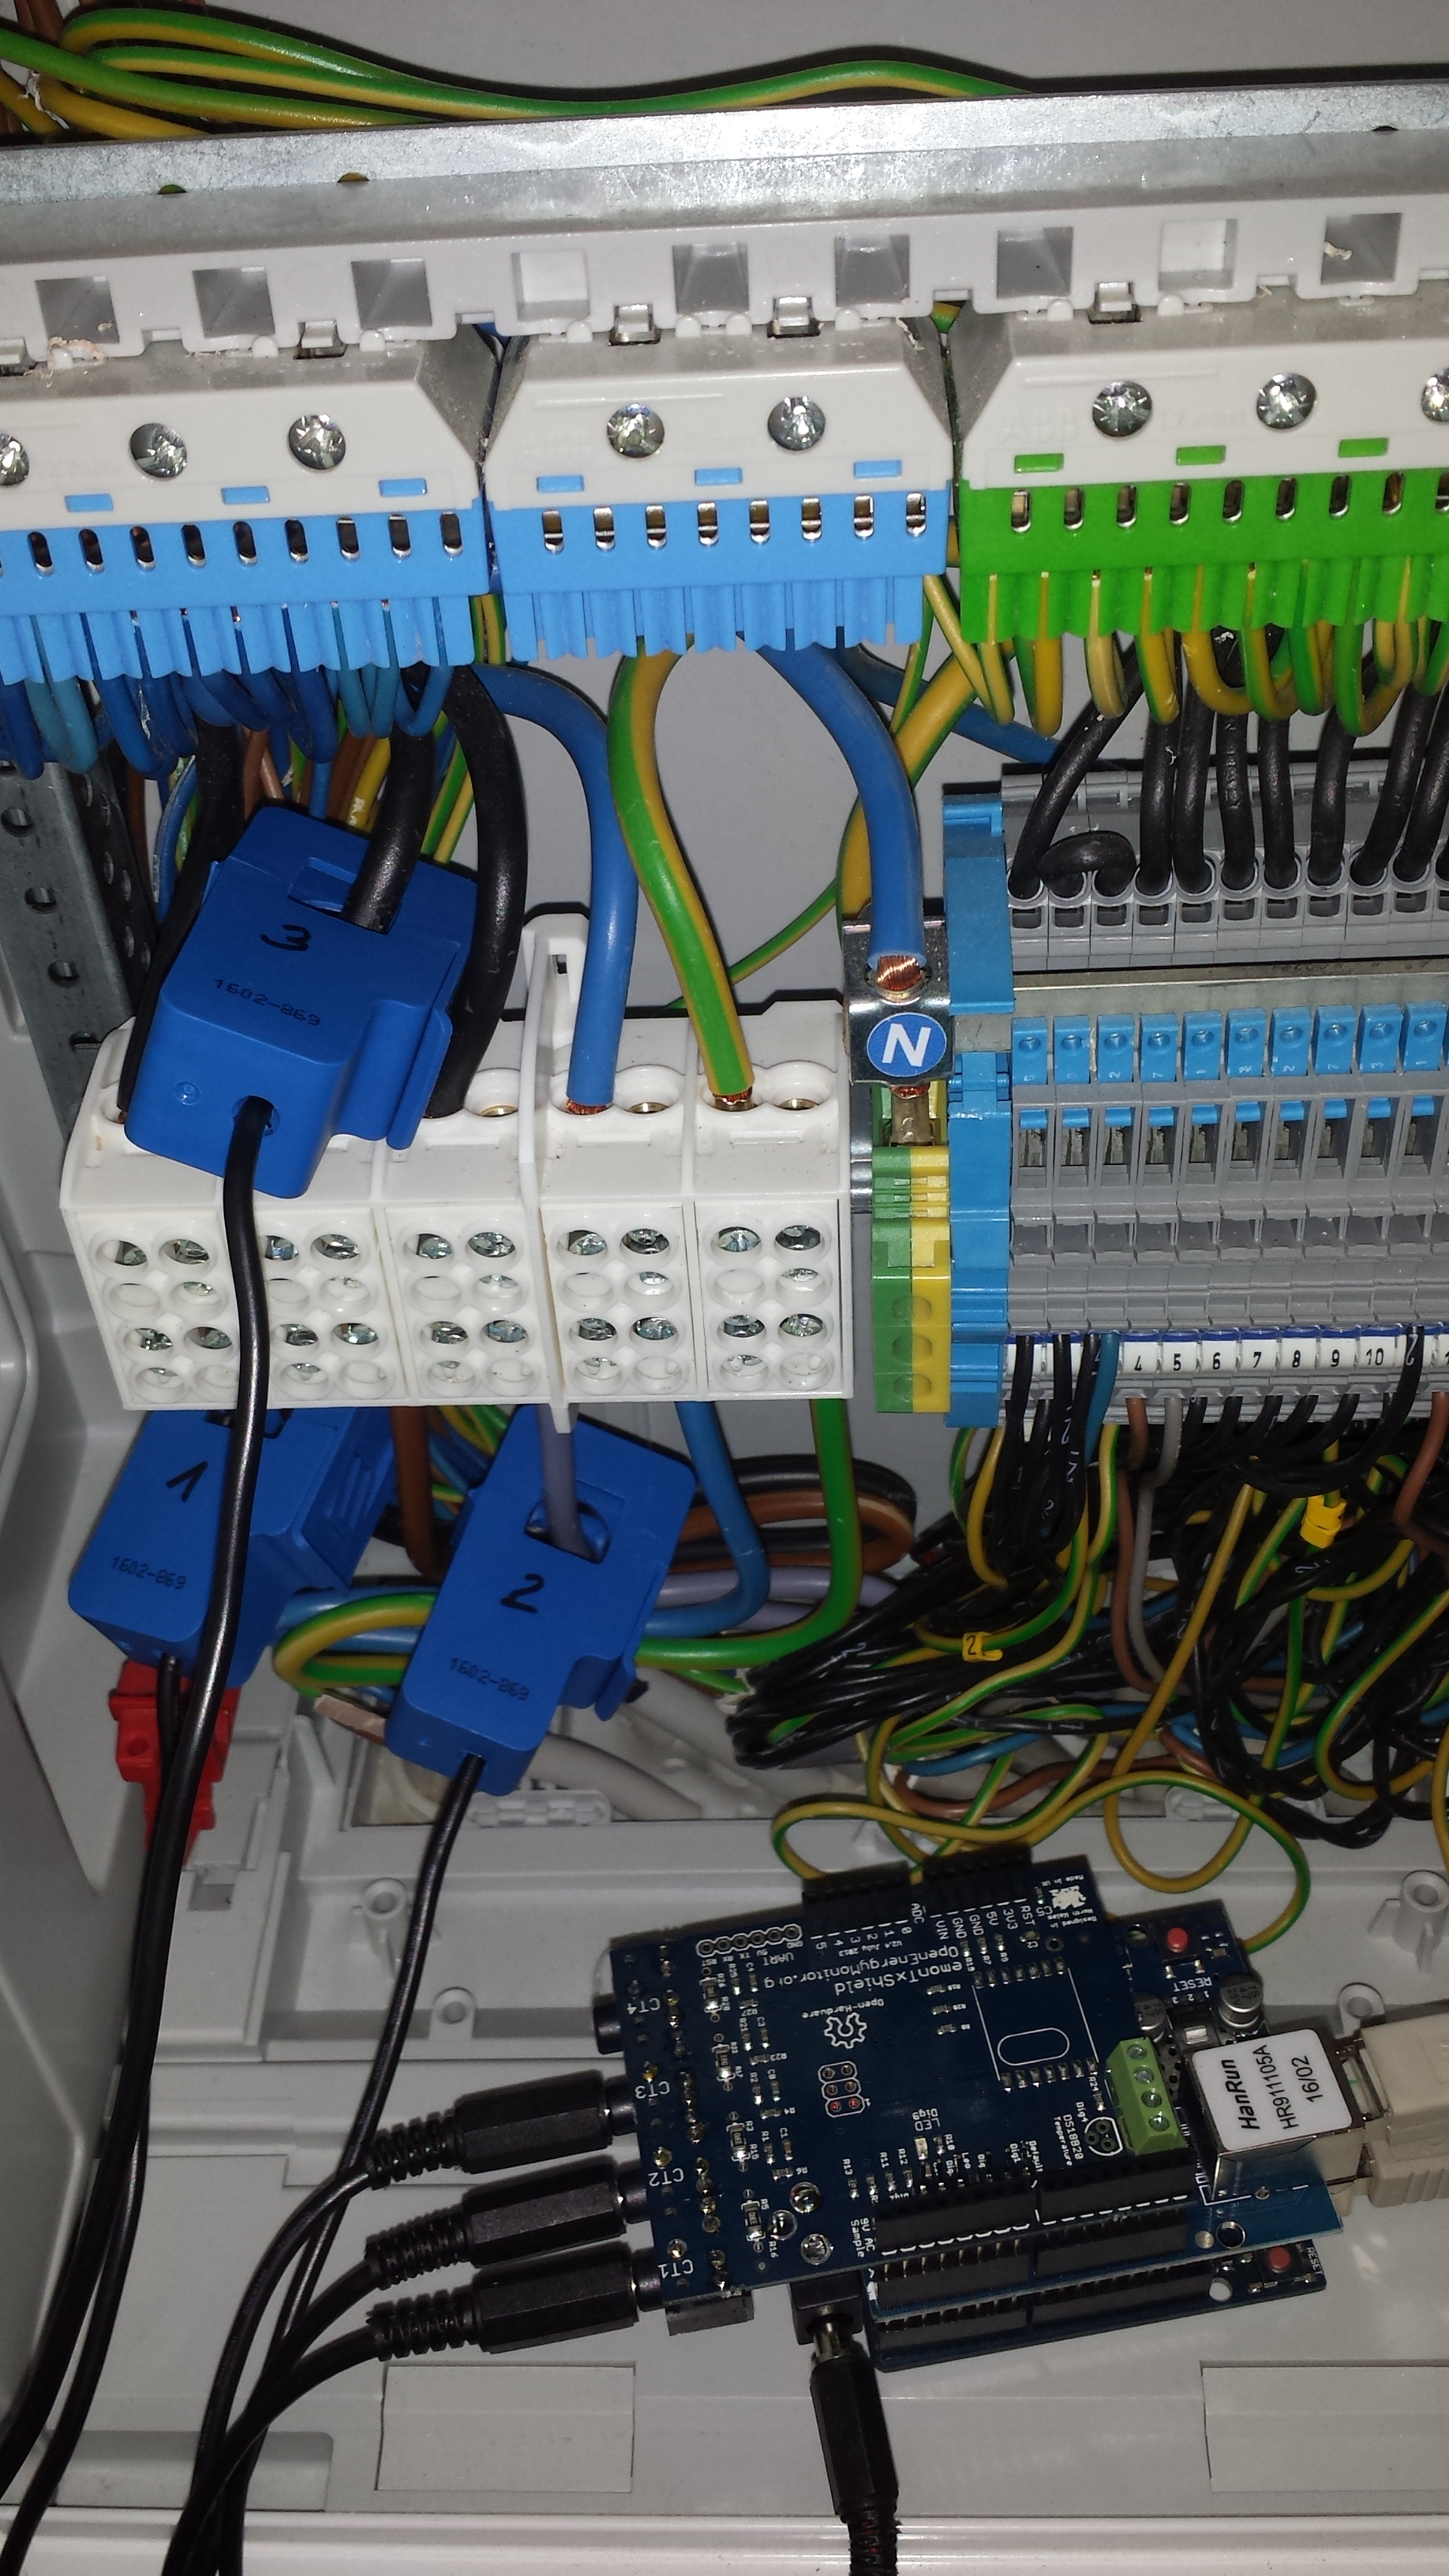
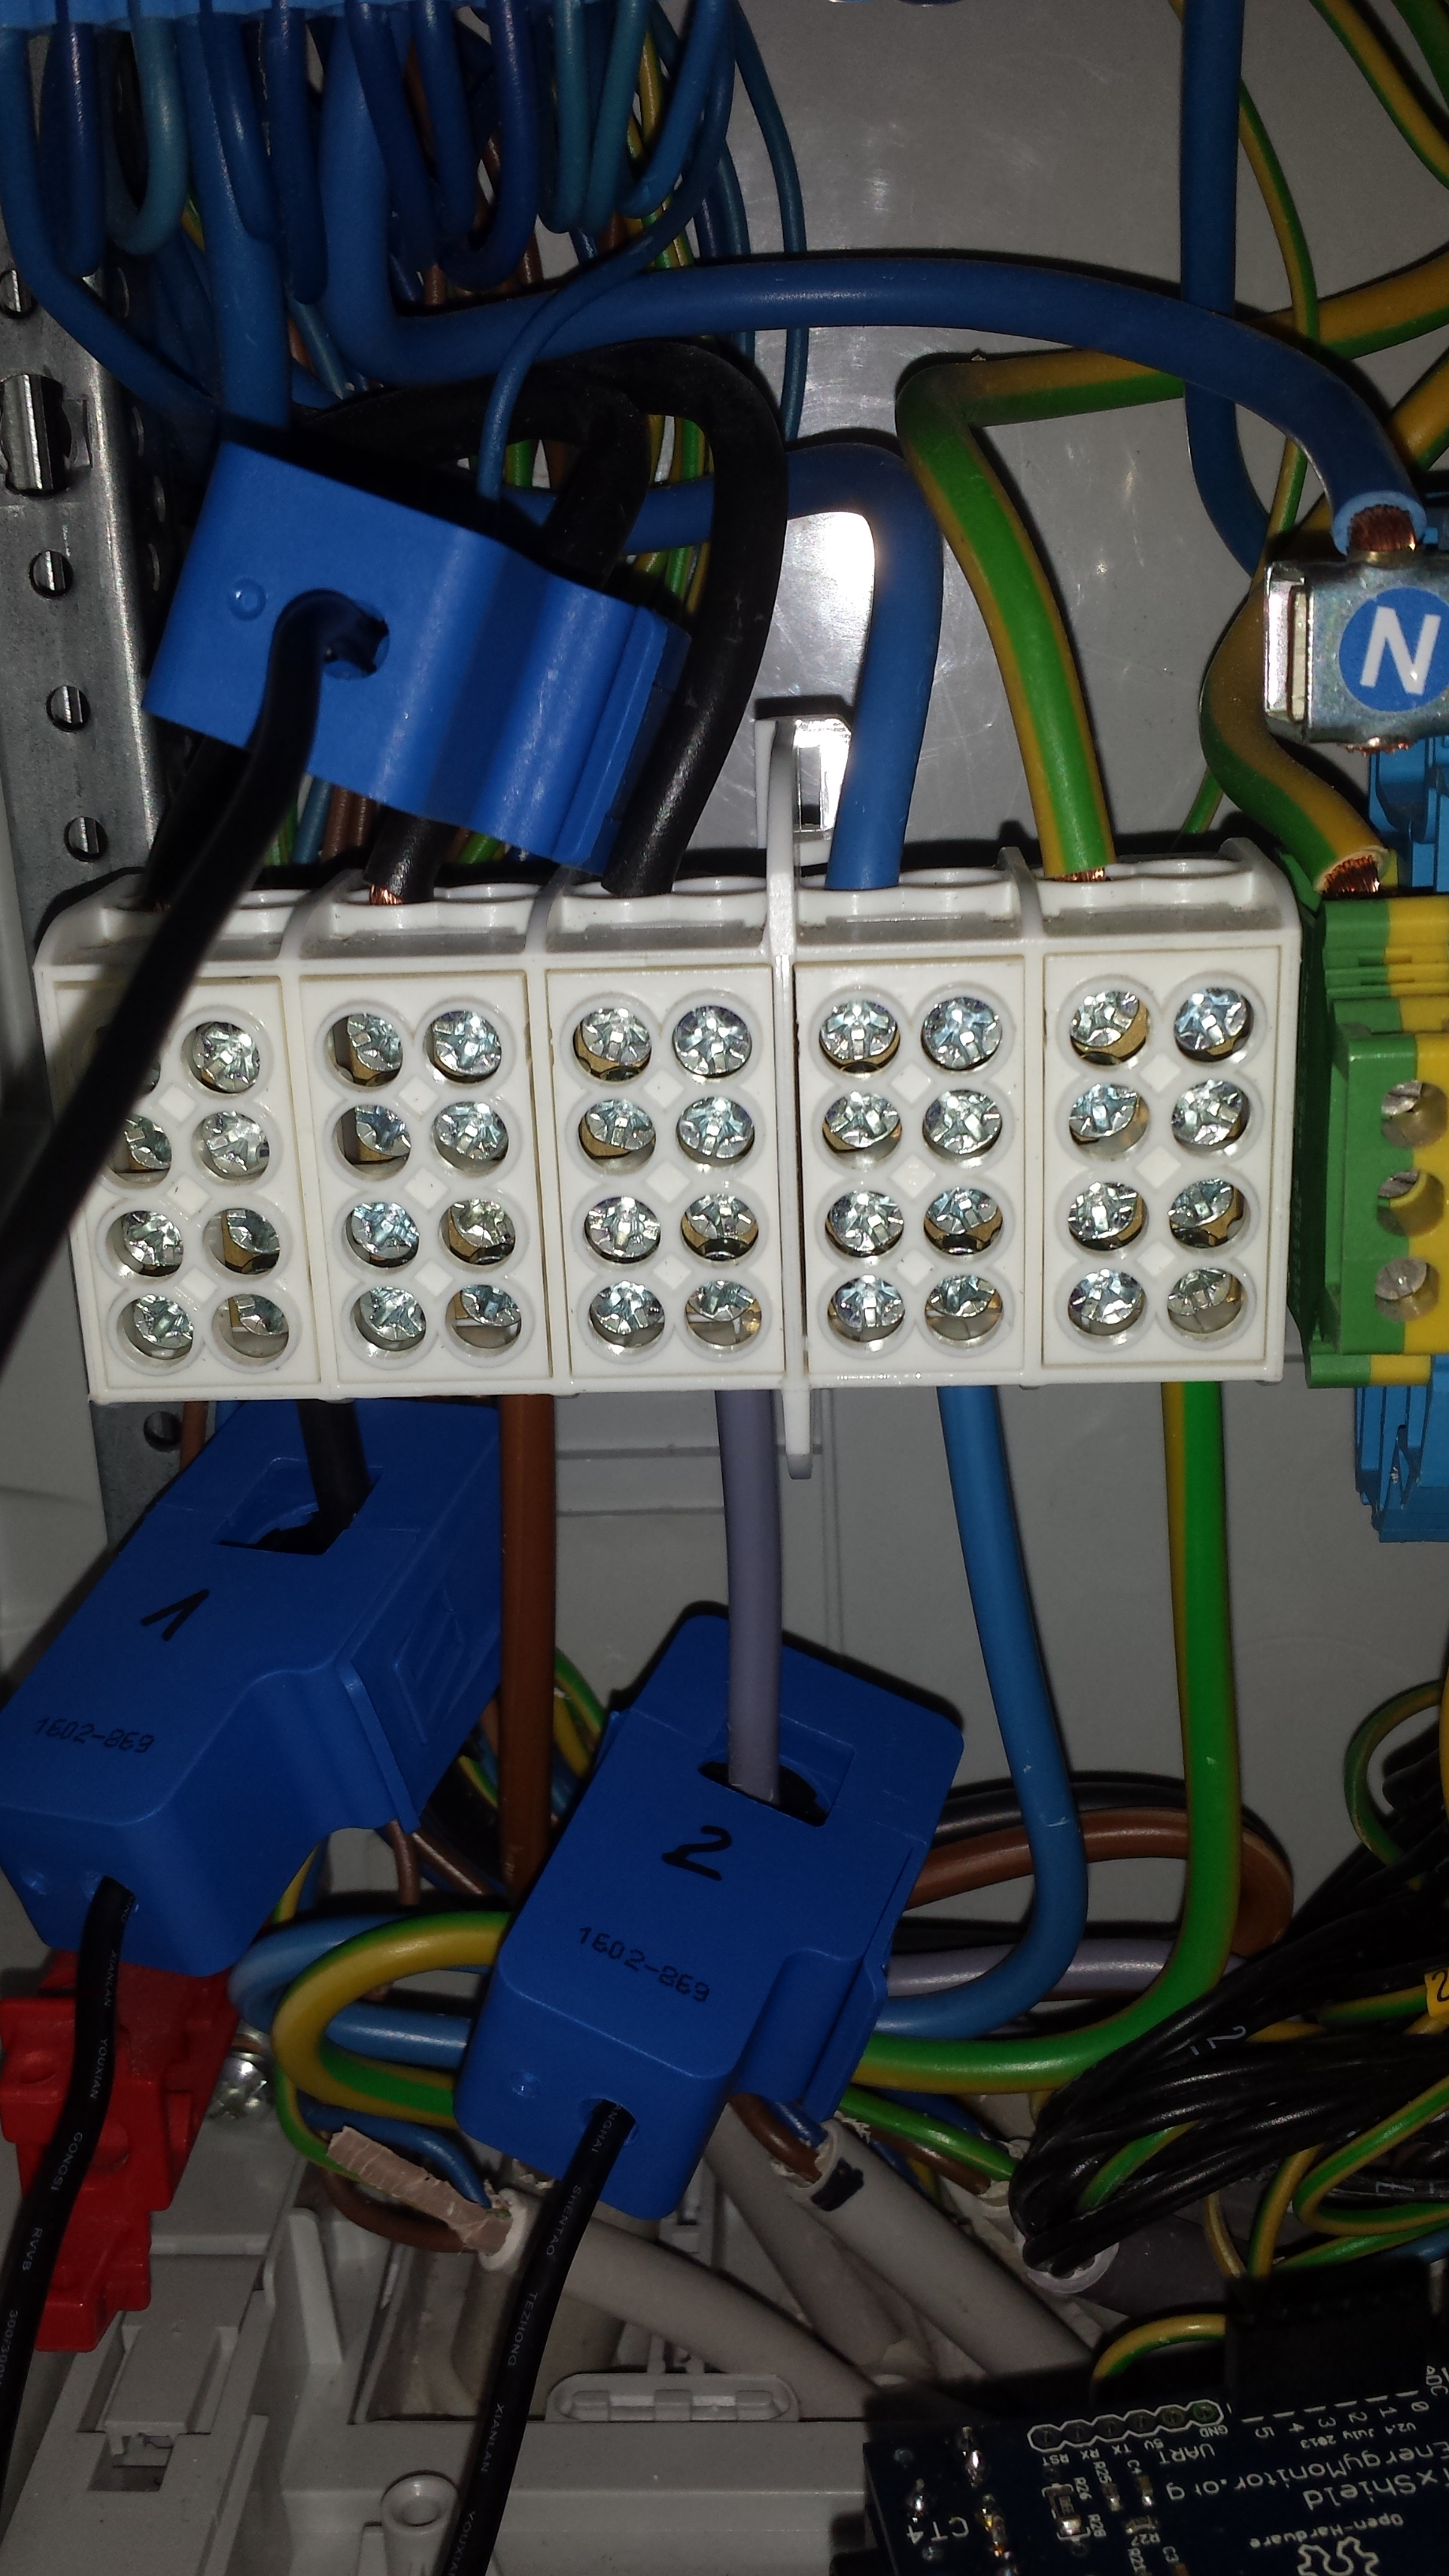
I’m quite new to the topic of energy monitoring and read most of the openenergymonitor sites to get a general understand (but I’m far away from knowing enough, I fear). I built my openenergymonitor with an arduino uno, ethernet shield, 9V ACD, emonTX shield and 3x SCT-013-000. We’ve a 3 phase power supply in germany by 230V.
The ADC is on the same phase as CT1, both are on phase 2. CT2 is on phase 3, CT3 is on phase 1. Hope this is correct, as the wave shift than is in the correct order but doesn’t start at 0 degree. As ADC and CT1 is on the same phase, this doesn’t matter, correct?

I use the sketch emonTxV3_4_3Phase_Voltage.ino, where CT4 is disabled. As explained in the code, I used this values

#undef CT4LINE 1

double Vcal = 228.7; // Calibration constant for voltage input
double Ical1 = 60.6; // Calibration constant for current transformer 1
double Ical2 = 60.6; // Calibration constant for current transformer 2
double Ical3 = 60.6; // Calibration constant for current transformer 3
double Ical4 = 16.6; // Calibration constant for current transformer 4

#define PHASE2 7 // Number of samples delay for L2

#define PHASE3 17 // Number of samples delay for L3
// Calibration coefficients common to all versions - see comments above
double Phasecal1 = 1.0; // Calibration constant for phase shift L1
double Phasecal2 = 0.22; // Calibration constant for phase shift L2
double Phasecal3 = 0.4; // Calibration constant for phase shift L3
double Phasecal4 = 1.10; // Calibration constant for phase shift CT 4

But unfortunately, I get negative real power on phase 3. Can please anybody help me, I fear the setup might be wrong.

Voltage: 225.68
Phase 1: 1.07 A, 89.44 W, 242.21 VA, PF=0.369
Phase 2: 0.79 A, 92.37 W, 179.01 VA, PF=0.516
Phase 3: 0.99 A, -85.72 W, 222.96 VA, PF=-0.384

Voltage: 225.44
Phase 1: 0.97 A, 88.78 W, 218.38 VA, PF=0.407
Phase 2: 0.66 A, 92.50 W, 148.63 VA, PF=0.622
Phase 3: 0.88 A, -89.11 W, 197.39 VA, PF=-0.451

Voltage: 225.43
Phase 1: 0.97 A, 87.60 W, 218.18 VA, PF=0.402
Phase 2: 0.70 A, 91.28 W, 157.46 VA, PF=0.580
Phase 3: 0.83 A, -82.99 W, 187.97 VA, PF=-0.442

Voltage: 225.79
Phase 1: 0.99 A, 95.39 W, 223.67 VA, PF=0.426
Phase 2: 0.65 A, 85.06 W, 147.75 VA, PF=0.576
Phase 3: 0.81 A, -76.25 W, 183.33 VA, PF=-0.416

Voltage: 225.69
Phase 1: 0.99 A, 95.15 W, 223.54 VA, PF=0.426
Phase 2: 0.68 A, 93.31 W, 153.58 VA, PF=0.608
Phase 3: 0.81 A, -82.57 W, 181.89 VA, PF=-0.454

Do you need some further information?
Thanks in advance for your assistance.
Regards,
Michael

That should be correct. Do all 3 current transformers face in the same direction? If the CT is facing in the wrong direction, that would explain a negative power.

I am a little worried by the very low power factor that phases V & W show. In order to test and calibrate your emonTx, it is most important that you have a load that is only pure resistance, and that should give a power factor of 1.0. As the comments in the sketch explain, you will need to have a pure resistor as the load and adjust Phasecal and, if necessary and for phases 2 & 3, PHASE2 & PHASE3. It must be possible to find a combination of Phasecal3 and PHASE3 that will give you a power factor of +1 (or very near) for a resistive load on phase U.

I would agree with Robert . Try flipping CT3 round the other way. then lets have a look at the results. Do you have an electric shower or something else that’s a large resistive load you can turn on to see what happens to your power factor,

Try putting all your CTs on the same phase and boil one litre of water. That should drain something like 2kW. I used this technique I learned from Robert.
Edited (modified link): See this thread https://openenergymonitor.org/emon/node/3793.

Walter

I’m not sure what that thread proves - the bug that it revealed was corrected some time ago.

There is a way to set up the three-phase sketch with a single load:

Set all 3 CTs on the same phase as the voltage monitor. All should face in the same direction. Arrange a pure resistive load on that phase. The load should ideally be representative of your normal operating load conditions.

  1. Adjust the current calibration so that all 3 phases show the same current and apparent power (volt-amperes).

  2. Adjust Phasecal1 so that the real power of phase 1 is the same as the apparent power, and power factor 1 = 1.0.

  3. Adjust Phasecal2 and if necessary PHASE2 so that the real power of phase 2 is exactly half the apparent power and negative, and power factor 2 = -0.5.

  4. Adjust Phasecal3 and if necessary PHASE3 so that the real power of phase 3 is exactly half the apparent power and negative, and power factor 3 = -0.5.

  5. Move CT2 onto the second phase, and CT3 onto the third phase. Calibration should now be correct.

Hi Robert,
thank for you very much for your detailed instructions. That’s exactly I did, exept from the fact, that I did my calibration not at my house power distribution. I made the calibration on a socket with a 2kW heater. All tree CTs were identical facing on the powerline. I adjusted Ical, Vcal and Phasecal (phase 1 with PF=1, phase 2 and 3 with PF=-0.5) as you described.
After that I made my installation at the main distribution. But real power at phase 3 is negative, all three CTs face the same way. Now I changed the sketch like this:
realPower3 = -1 * V_Ratio * I_Ratio3 * sumP3 / numberOfPowerSamples; apparentPower3 = Vrms * Irms3; powerFactor3 = realPower3 / apparentPower3;
Now the realpower and PF are positive, but I’m quite unsure, if everything now is OK?
Some example values look like this:
`Voltage: 227.94
Phase 1: 1.01 A, 128.12 W, 230.96 VA, PF=0.555
Phase 2: 0.65 A, 79.26 W, 147.44 VA, PF=0.538
Phase 3: 0.98 A, 131.79 W, 223.90 VA, PF=0.589

Voltage: 225.23
Phase 1: 0.95 A, 123.33 W, 214.34 VA, PF=0.575
Phase 2: 0.55 A, 85.50 W, 124.50 VA, PF=0.687
Phase 3: 0.86 A, 131.07 W, 194.02 VA, PF=0.676

Voltage: 225.74
Phase 1: 0.93 A, 126.41 W, 210.92 VA, PF=0.599
Phase 2: 0.54 A, 86.47 W, 122.48 VA, PF=0.706
Phase 3: 0.82 A, 136.14 W, 184.84 VA, PF=0.737

Voltage: 225.85
Phase 1: 0.98 A, 133.95 W, 222.40 VA, PF=0.602
Phase 2: 0.52 A, 82.42 W, 118.20 VA, PF=0.697
Phase 3: 0.84 A, 138.16 W, 189.52 VA, PF=0.729
`
Do the PF look realistic for a normal household?

Well, I ordered a clamp meter to check the current on my 3 phases. It should arrive this week, but how can I proof the phase shift?

Regards,
Michael

Perfect!

I think you should not need the (* -1). Something is wrong. You do have a 3-phase, 4-wire supply; that is, there are 3 phases U, V & W and a neutral conductor, and you measure 230 V between each phase and neutral, and 400 V between each combination of 2 phases?

You will not be able to measure phase angle nor power factor, except with specialised instruments. The only way you can check your emonTx is by comparing the readings with your supplier’s meter. Certainly, power factors of 0.7 are more likely with low power loads like you have, than with high power appliances like heaters, kettle, cooker etc. So I would say that p.f. of 0.7 is not necessarily wrong.

That’s right, I’m having a 4-wire supply. Is calibration than another way or do I need another sketch?
Sorry, for my little knowledge about this all …
I attach a foto of my situation in the main distribution, maybe you can find an obvious failure. From left to right:
CT1: phase 2 = black
CT3: phase 1= brown
CT2: phase 3 = grey
So the CTs should be in the correct order (phase 2 - phase 3 - phase 1). My ADC is connected to phase 2, therefore this shifted order.


Thank you so much for your help!

This gets even more puzzling.

You are correct. The standard phase colours are Phase 1 (U) = brown, Phase 2 (V) = black, Phase 3 (W) = grey. The only “error” that I can see is the wires have been put into the terminal block in the sequence 2 - 1 - 3.
Absolute phase does not exist, so what you have done, to make the phase order for the emonTx black - grey - brown, should be correct as far as the sketch is concerned. The CTs all face the right way, and all gave the correct result when you calibrated them on the same wire, so that eliminates a CT wired in reverse.

The only way that I can think of for power to be negative, given that the CT is installed correctly, is for the phase 3 voltage wave to be shifted by 240° ± 180°, that is 60° or 420°, and that is clearly not true - both the numbers for PHASE2 & PHASE3 and the calibration test confirm it. (The standard “discrete sample” sketch records 2 measurements about 50 times per cycle. This sketch records 4 measurements, so very approximately 25 times per cycle, therefore the phases should be approx. 8⅓ array elements apart, which at 0, 7 and 17 they are.)

There must be a rational explanation, but I cannot see what it is.

Hi Robert,
some tries and errors and recalibration it looks much better :slight_smile:
Seems that my electician didn’t care of standards, so the phases are L1=black, L2=brown, L3=grey.
Thanks a lot for your efforts, it did help to get your thoughts.
Regards,
Michael