@borpin
Many thx for sticking with my problem.
I’ve now adjusted watchman’s logging level for emoncms log. I tried it by sending an API FEED request for a value and time to a feed that existed and to a feed that did not exist. The log clearly reported both instances.
I’ve now located the help section on API INPUTS - it’s under Inputs - obvious when you you know how 
In blind faith I tried yr suggested Legacy format line in a remote TX/RPI. It reported - failed to connect to the IP address, timed out. But I expected this as the API key & specfic IP address are not relevant to my system.
I’m a bit concerned about sending random test data to watchman in case it screws things up - valuable data that I’ve exported as a precaution.
However remote TX/RPi Node 12 is at an outdoor pool now closed for the season so it’s data can be a sacrificial lamb.
I rebooted Node 12 to eliminate the 3 day buffer of unsent data. Then I copied the emonhub send from the log, added curl and the API key data and sent this from a Node 12 dataplicity terminal with the following results …
pi@emonpi-node-12:/ $ curl http://192.168.1.100/emoncms/input/bulk.json?apikey=4448328134be7b9b3f0447f49f910e8b&data=[[1574032954.700755,12,9,0,0,0,254.37,19.700000000000003,6.300000000000001,6.300000000000001,5.5,6.1000000000000005],[1574032964.600453,12,6,0,0,0,254.59,19.700000000000003,6.2,6.300000000000001,5.5,6.1000000000000005],[1574032982.282405,12,7,0,0,0,254.32,19.700000000000003,6.300000000000001,6.300000000000001,5.5,6.1000000000000005]]&sentat=1574032985
[1] 3553
[2] 3554
[2]+ Done data=[[1574032954.700755,12,9,0,0,0,254.37,19.700000000000003,6.300000000000001,6.300000000000001,5.5,6.1000000000000005],[1574032964.600453,12,6,0,0,0,254.59,19.700000000000003,6.2,6.300000000000001,5.5,6.1000000000000005],[1574032982.282405,12,7,0,0,0,254.32,19.700000000000003,6.300000000000001,6.300000000000001,5.5,6.1000000000000005]]
pi@emonpi-node-12:/ $ <body><script language="javaScript">window.parent.document.cookie="Authorization=;path=/";
window.parent.location.href = "http://192.168.1.100";
</script></body></html>
The response is familiar.
It appears that Node 12 data is sent to watchman but watchman has not well received it to the point of sending its standard ok response.
Could it be that the 3553 & 3554 are significant?
I appreciate that I have not tried sending the data in yr suggested curl --data data=[~~~~ format.
But is this likely to give a different result?
I installed tshark on remote TX/RPi (node 14) and had success with yr “port 80” command …
7 0.006220022 192.168.1.14 → 192.168.1.100 HTTP 439 POST /emoncms/input/bulk.json?apikey=4448328134be7b9b3f0447f49f910e8b HTTP/1.1 (application/x-www-form-urlencoded)
8 0.033410773 192.168.1.100 → 192.168.1.14 TCP 66 80 → 45018 [ACK] Seq=1 Ack=1449 Win=8688 Len=0 TSval=1318087915 TSecr=1892923141
9 0.033429627 192.168.1.100 → 192.168.1.14 TCP 66 80 → 45018 [ACK] Seq=1 Ack=2897 Win=11584 Len=0 TSval=1318087915 TSecr=1892923141
10 0.033442387 192.168.1.100 → 192.168.1.14 TCP 66 80 → 45018 [ACK] Seq=1 Ack=4345 Win=14480 Len=0 TSval=1318087916 TSecr=1892923141
11 0.033454731 192.168.1.100 → 192.168.1.14 TCP 66 80 → 45018 [ACK] Seq=1 Ack=4718 Win=17376 Len=0 TSval=1318087916 TSecr=1892923141
12 0.033466710 192.168.1.100 → 192.168.1.14 TCP 75 80 → 45018 [PSH, ACK] Seq=1 Ack=4718 Win=17376 Len=9 TSval=1318087916 TSecr=1892923141 [TCP segment of a reassembled PDU]
13 0.033663897 192.168.1.14 → 192.168.1.100 TCP 66 45018 → 80 [ACK] Seq=4718 Ack=10 Win=29312 Len=0 TSval=1892923168 TSecr=1318087916
14 0.033479575 192.168.1.100 → 192.168.1.14 HTTP 388 HTTP/1.1 200 OK (text/html)
15 0.033505512 192.168.1.100 → 192.168.1.14 TCP 66 80 → 45018 [RST, ACK] Seq=333 Ack=4718 Win=17376 Len=0 TSval=1318087916 TSecr=1892923141
16 0.037801741 192.168.1.100 → 192.168.1.14 TCP 60 80 → 45018 [RST] Seq=10 Win=0 Len=0
17 30.128464238 192.168.1.14 → 192.168.1.100 TCP 74 45020 → 80 [SYN] Seq=0 Win=29200 Len=0 MSS=1460 SACK_PERM=1 TSval=1892953263 TSecr=0 WS=128
18 30.135410245 192.168.1.100 → 192.168.1.14 TCP 74 80 → 45020 [SYN, ACK] Seq=0 Ack=1 Win=5792 Len=0 MSS=1460 SACK_PERM=1 TSval=1318095441 TSecr=1892953263 WS=2
19 30.135551651 192.168.1.14 → 192.168.1.100 TCP 66 45020 → 80 [ACK] Seq=1 Ack=1 Win=29312 Len=0 TSval=1892953270 TSecr=1318095441
20 30.135702900 192.168.1.14 → 192.168.1.100 TCP 1514 POST /emoncms/input/bulk.json?apikey=4448328134be7b9b3f0447f49f910e8b HTTP/1.1 [TCP segment of a reassembled PDU]
21 30.135764254 192.168.1.14 → 192.168.1.100 TCP 1514 45020 → 80 [ACK] Seq=1449 Ack=1 Win=29312 Len=1448 TSval=1892953270 TSecr=1318095441 [TCP segment of a reassembled PDU]
22 30.135813420 192.168.1.14 → 192.168.1.100 TCP 1514 45020 → 80 [PSH, ACK] Seq=2897 Ack=1 Win=29312 Len=1448 TSval=1892953270 TSecr=1318095441 [TCP segment of a reassembled PDU]
Line 14 shows watchman (192.168.1.100) sending OK (text/html) to the remote TX/RPi (192.168.1.14).
In yr post above, the OK’s are OK (text/plain) and OK (application/json).
These OK’s are different - is it sgnificant?
watchman’s emonCMS log at this same time revealed …
2019-11-18 19:56:56.729|INFO|rememberme_model.php|login
2019-11-18 19:56:56.730|INFO|rememberme_model.php|getCookieValues: not present
2019-11-18 19:56:56.740|INFO|user_model.php|get_preferences()|Empty User preferences
2019-11-18 19:56:56.757|INFO|user_model.php|get_preferences()|Empty User preferences
2019-11-18 19:57:12.977|INFO|index.php|user/login.json
2019-11-18 19:57:12.983|INFO|rememberme_model.php|login
2019-11-18 19:57:12.984|INFO|rememberme_model.php|getCookieValues: not present
2019-11-18 19:57:12.988|INFO|rememberme_model.php|clearCookie
2019-11-18 19:57:12.989|INFO|rememberme_model.php|getCookieValues: not present
2019-11-18 19:57:13.190|INFO|index.php|feed/list
2019-11-18 19:57:13.218|INFO|user_model.php|get_preferences()|bookmarks|String(85) = [{"path":"admin\/view","text":"Administration"},{"…
2019-11-18 19:57:13.240|INFO|user_model.php|get_preferences()|bookmarks|String(85) = [{"path":"admin\/view","text":"Administration"},{"…
2019-11-18 19:57:13.811|INFO|index.php|feed/list.json
2019-11-18 19:57:13.820|INFO|feed_model.php|EngineClass() Autoloaded new instance of 'PHPTimeSeries'.
2019-11-18 19:57:13.826|INFO|feed_model.php|EngineClass() Autoloaded new instance of 'PHPFina'.
2019-11-18 19:57:13.869|INFO|index.php|process/list.json
2019-11-18 19:57:13.874|INFO|index.php|schedule/list.json
2019-11-18 19:57:13.882|INFO|index.php|feed/list.json
2019-11-18 19:57:13.886|INFO|index.php|input/list.json
2019-11-18 19:57:14.192|INFO|feed_model.php|EngineClass() Autoloaded new instance of 'PHPTimeSeries'.
2019-11-18 19:57:14.199|INFO|feed_model.php|EngineClass() Autoloaded new instance of 'PHPFina'.
2019-11-18 19:57:18.797|INFO|index.php|feed/list.json
2019-11-18 19:57:18.812|INFO|feed_model.php|EngineClass() Autoloaded new instance of 'PHPTimeSeries'.
2019-11-18 19:57:18.820|INFO|feed_model.php|EngineClass() Autoloaded new instance of 'PHPFina'.
2019-11-18 19:57:18.865|INFO|index.php|admin/view
2019-11-18 19:57:19.776|INFO|user_model.php|get_preferences()|bookmarks|String(85) = [{"path":"admin\/view","text":"Administration"},{"…
2019-11-18 19:57:19.788|INFO|user_model.php|get_preferences()|bookmarks|String(85) = [{"path":"admin\/view","text":"Administration"},{"…
2019-11-18 19:57:20.181|INFO|index.php|admin/getlog
2019-11-18 19:57:20.186|INFO|index.php|feed/buffersize.json
2019-11-18 19:57:20.195|INFO|index.php|admin/emonpi/getupdatelog
2019-11-18 19:58:59.787|INFO|index.php|admin/downloadlog
Anything of significance?
I then started to look at the logs …
apache2 access log had no errors or warnings
The apache 2 error log was different … It had many similar errors to this at the time in question …
[Mon Nov 18 19:57:19.769510 2019] [:error] [pid 14474] [client 127.0.0.1:58146] PHP Notice: Undefined index: hw in /var/www/emoncms/Modules/admin/admin_main_view.php on line 397, referer: https://inXXXXXXXXXXXXXXXXaplicity.io/emoncms/feed/list
Here’s the relevant stanza in admin_main_view.php
<?php if (!empty(implode('',$rpi_info))) : ?>
<h4 class="text-info text-uppercase border-top pt-2 mt-0 px-1"><?php echo _('Pi'); ?></h4>
<dl class="row">
<?php echo row(sprintf('<span class="align-self-center">%s</span>',_('Model')), $rpi_info['model'].'<div>'.RebootBtn().Shutdown$
<!-- <?php echo row(_('SoC'), $rpi_info['hw']) ?> -->
<?php echo row(_('Serial num.'), strtoupper(ltrim($rpi_info['sn'], '0'))) ?>
<?php echo row(_('Temperature'), sprintf('%s - %s', $rpi_info['cputemp'], $rpi_info['gputemp'])) ?>
<?php echo row(_('emonpiRelease'), $rpi_info['emonpiRelease']) ?>
<?php echo row(_('File-system'), $rpi_info['currentfs']) ?>
</dl>
<?php endif; ?>
Does that throw any light on the problem?
I then looked at the mysql logs …
2019-11-15 18:28:10 1638232896 [Note] /usr/sbin/mysqld: Normal shutdown
2019-11-15 18:28:10 1638232896 [Note] Event Scheduler: Purging the queue. 0 events
2019-11-15 18:28:10 1426060096 [Note] InnoDB: FTS optimize thread exiting.
2019-11-15 18:28:10 1638232896 [Note] InnoDB: Starting shutdown...
2019-11-15 18:28:11 1638232896 [Note] InnoDB: Waiting for page_cleaner to finish flushing of buffer pool
2019-11-15 18:28:11 1638232896 [Note] InnoDB: Shutdown completed; log sequence number 1618187
2019-11-15 18:28:12 1638232896 [Note] /usr/sbin/mysqld: Shutdown complete
2019-11-15 18:28:13 1988194304 [Note] InnoDB: Using mutexes to ref count buffer pool pages
2019-11-15 18:28:13 1988194304 [Note] InnoDB: The InnoDB memory heap is disabled
2019-11-15 18:28:13 1988194304 [Note] InnoDB: Mutexes and rw_locks use GCC atomic builtins
2019-11-15 18:28:13 1988194304 [Note] InnoDB: GCC builtin __atomic_thread_fence() is used for memory barrier
2019-11-15 18:28:13 1988194304 [Note] InnoDB: Compressed tables use zlib 1.2.8
2019-11-15 18:28:13 1988194304 [Note] InnoDB: Using Linux native AIO
2019-11-15 18:28:13 1988194304 [Note] InnoDB: Using generic crc32 instructions
2019-11-15 18:28:13 1988194304 [Note] InnoDB: Initializing buffer pool, size = 128.0M
2019-11-15 18:28:13 1988194304 [Note] InnoDB: Completed initialization of buffer pool
2019-11-15 18:28:14 1988194304 [Note] InnoDB: Highest supported file format is Barracuda.
2019-11-15 18:28:14 1988194304 [Note] InnoDB: 128 rollback segment(s) are active.
2019-11-15 18:28:14 1988194304 [Note] InnoDB: Waiting for purge to start
2019-11-15 18:28:14 1988194304 [Note] InnoDB: Percona XtraDB (http://www.percona.com) 5.6.35-80.0 started; log sequence number 1618187
2019-11-15 18:28:14 1442837312 [Note] InnoDB: Dumping buffer pool(s) not yet started
2019-11-15 18:28:14 1988194304 [Note] Plugin 'FEEDBACK' is disabled.
2019-11-15 18:28:14 1988194304 [Note] Server socket created on IP: '127.0.0.1'.
2019-11-15 18:28:14 1988194304 [Note] /usr/sbin/mysqld: ready for connections.
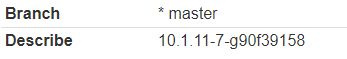
Version: '10.1.23-MariaDB-9+deb9u1' socket: '/home/pi/data/mysql/mysql.sock' port: 3306 Raspbian 9.0
Nothing untoward I think - just documenting a reboot?
I feel to have gone full circle. The problem does seem to be with mariadb per my initial forum post …
2019-11-14 16:15:49 1988837376 [Note] InnoDB: The InnoDB memory heap is disabled
2019-11-14 16:15:49 1988837376 [Note] InnoDB: Mutexes and rw_locks use GCC atomic builtins
2019-11-14 16:15:49 1988837376 [Note] InnoDB: GCC builtin __atomic_thread_fence() is used for memory barrier
2019-11-14 16:15:49 1988837376 [Note] InnoDB: Compressed tables use zlib 1.2.8
2019-11-14 16:15:49 1988837376 [Note] InnoDB: Using Linux native AIO
2019-11-14 16:15:49 1988837376 [Note] InnoDB: Using generic crc32 instructions
2019-11-14 16:15:49 1988837376 [Note] InnoDB: Initializing buffer pool, size = 128.0M
2019-11-14 16:15:49 1988837376 [Note] InnoDB: Completed initialization of buffer pool
2019-11-14 16:15:49 1988837376 [Note] InnoDB: Highest supported file format is Barracuda.
2019-11-14 16:15:49 1988837376 [Note] InnoDB: The log sequence numbers 1618147 and 1618147 in ibdata files do not match the log sequence number 1618167 in the ib_logfiles!
2019-11-14 16:15:49 1988837376 [Note] InnoDB: Restoring possible half-written data pages from the doublewrite buffer...
2019-11-14 16:15:49 1988837376 [Note] InnoDB: 128 rollback segment(s) are active.
2019-11-14 16:15:49 1988837376 [Note] InnoDB: Waiting for purge to start
2019-11-14 16:15:49 1988837376 [Note] InnoDB:  Percona XtraDB (http://www.percona.com) 5.6.35-80.0 started; log sequence number 1618167
2019-11-14 16:15:50 1447031616 [Note] InnoDB: Dumping buffer pool(s) not yet started
2019-11-14 16:15:50 1988837376 [Note] Plugin 'FEEDBACK' is disabled.
2019-11-14 16:15:50 1988837376 [Note] Recovering after a crash using tc.log
2019-11-14 16:15:50 1988837376 [Note] Starting crash recovery...
2019-11-14 16:15:50 1988837376 [Note] Crash recovery finished.
2019-11-14 16:15:50 1988837376 [Note] Server socket created on IP: '127.0.0.1'.
2019-11-14 16:15:50 1988837376 [Note] /usr/sbin/mysqld: ready for connections.
Version: '10.1.23-MariaDB-9+deb9u1'  socket: '/home/pi/data/mysql/mysql.sock'  port: 3306  Raspbian 9.0
2019-11-15 13:34:11 1639236416 [ERROR] mysqld: Table './emoncms/feeds' is marked as crashed and should be repaired
2019-11-15 13:34:11 1639236416 [Warning] Checking table:   './emoncms/feeds'
At the time, I repaired mysql and updated the database via the emon Admin page- but to no avail.
Is the key line …
2019-11-15 13:34:11 1639236416 [ERROR] mysqld: Table './emoncms/feeds' is marked as crashed and should be repaired
If so - how to do that repair?
Where is ./emoncms/feeds? - I cannot find it.
Again- many thx