Today (29 Apr 2020) the mains went down for about an hour.
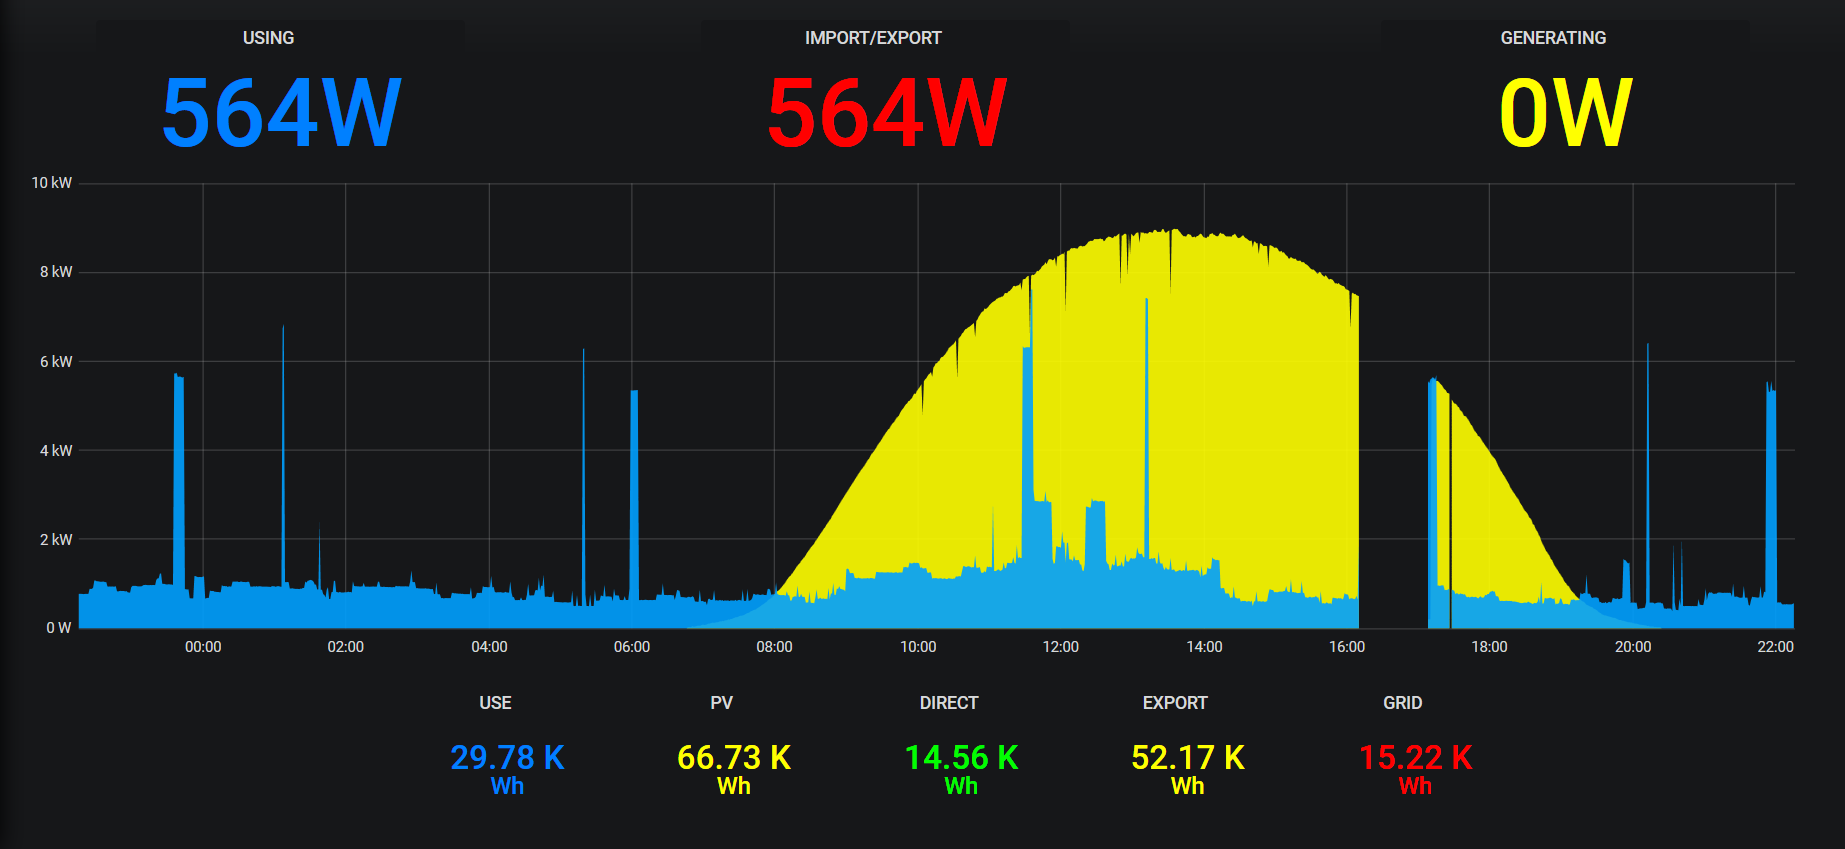
About six hours later, I saw this:

Shouldn’t it look similar to this? i.e with a gap vice the “block” as in the pic above.
Today (29 Apr 2020) the mains went down for about an hour.
About six hours later, I saw this:
Shouldn’t it look similar to this? i.e with a gap vice the “block” as in the pic above.
Hi,
I think, that’s not a bug of the graph… the graph just shows what you get in the corresponding feed.
Could you please check the corresponding feed (probably ‘solar’)?
Hi Fred,
Both graphs use the same feed.