My Heat Pump Dashboard V2

Hi All,

I’ve been thinking the MyHeatPump Dashboard could do with a bit of a refresh and I have access to Claude Code (AI) to help me, I’ve taken the original source as the starting point and have been improving and testing it. Not sure what I should be doing with it though, its currently running locally with an import of my data. Sorry if this isn’t the right place for this.

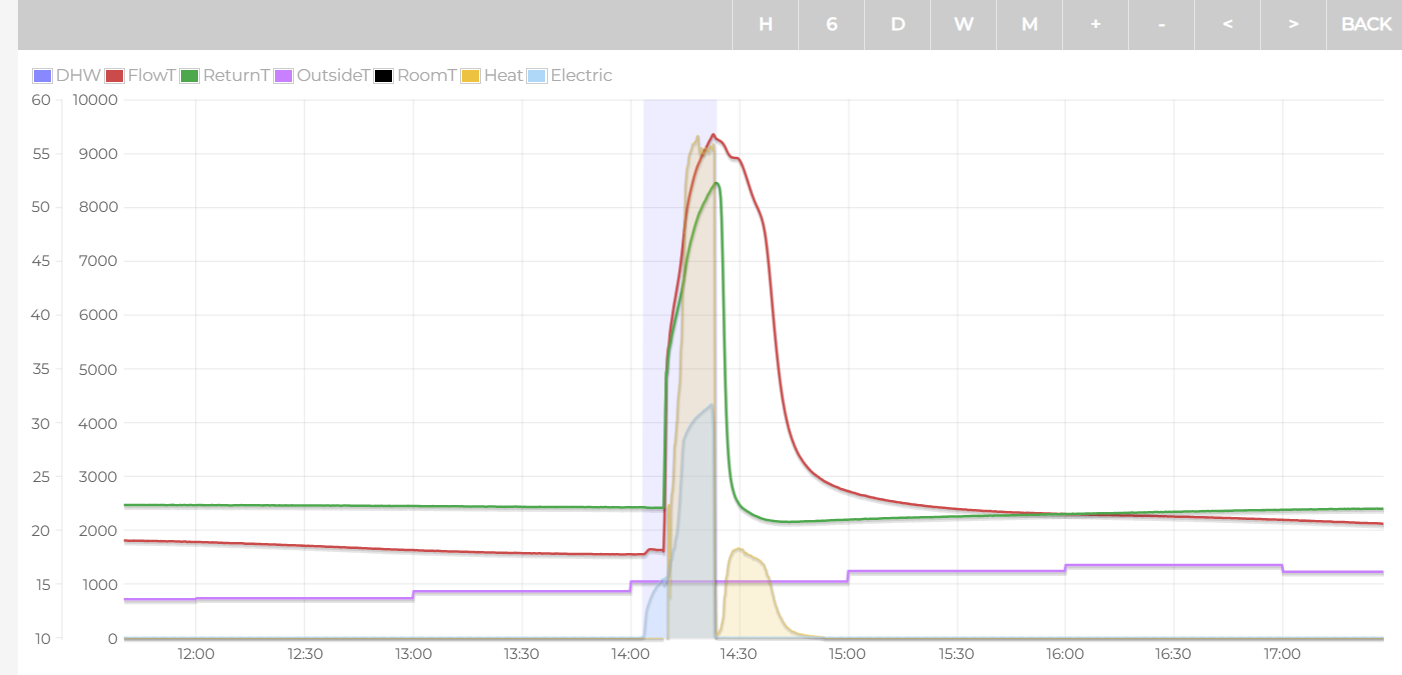
Using Chart.js v4, replacing jQuery Flot which hasn’t had a meaningful release since ~2020. Same feeds, same data, no reconfiguration needed.

Navigation
original dashboard drill-down (bar → day → power graph) is extended to a full hierarchy: All Time → Year → Month → Week → Day → Power Graph.
Period buttons now snap to actual calendar periods (Month = 1st to last day, not “last 30 days”) and Prev/Next steps correctly through calendar months and years. A Live button jumps to the most recent data from anywhere.
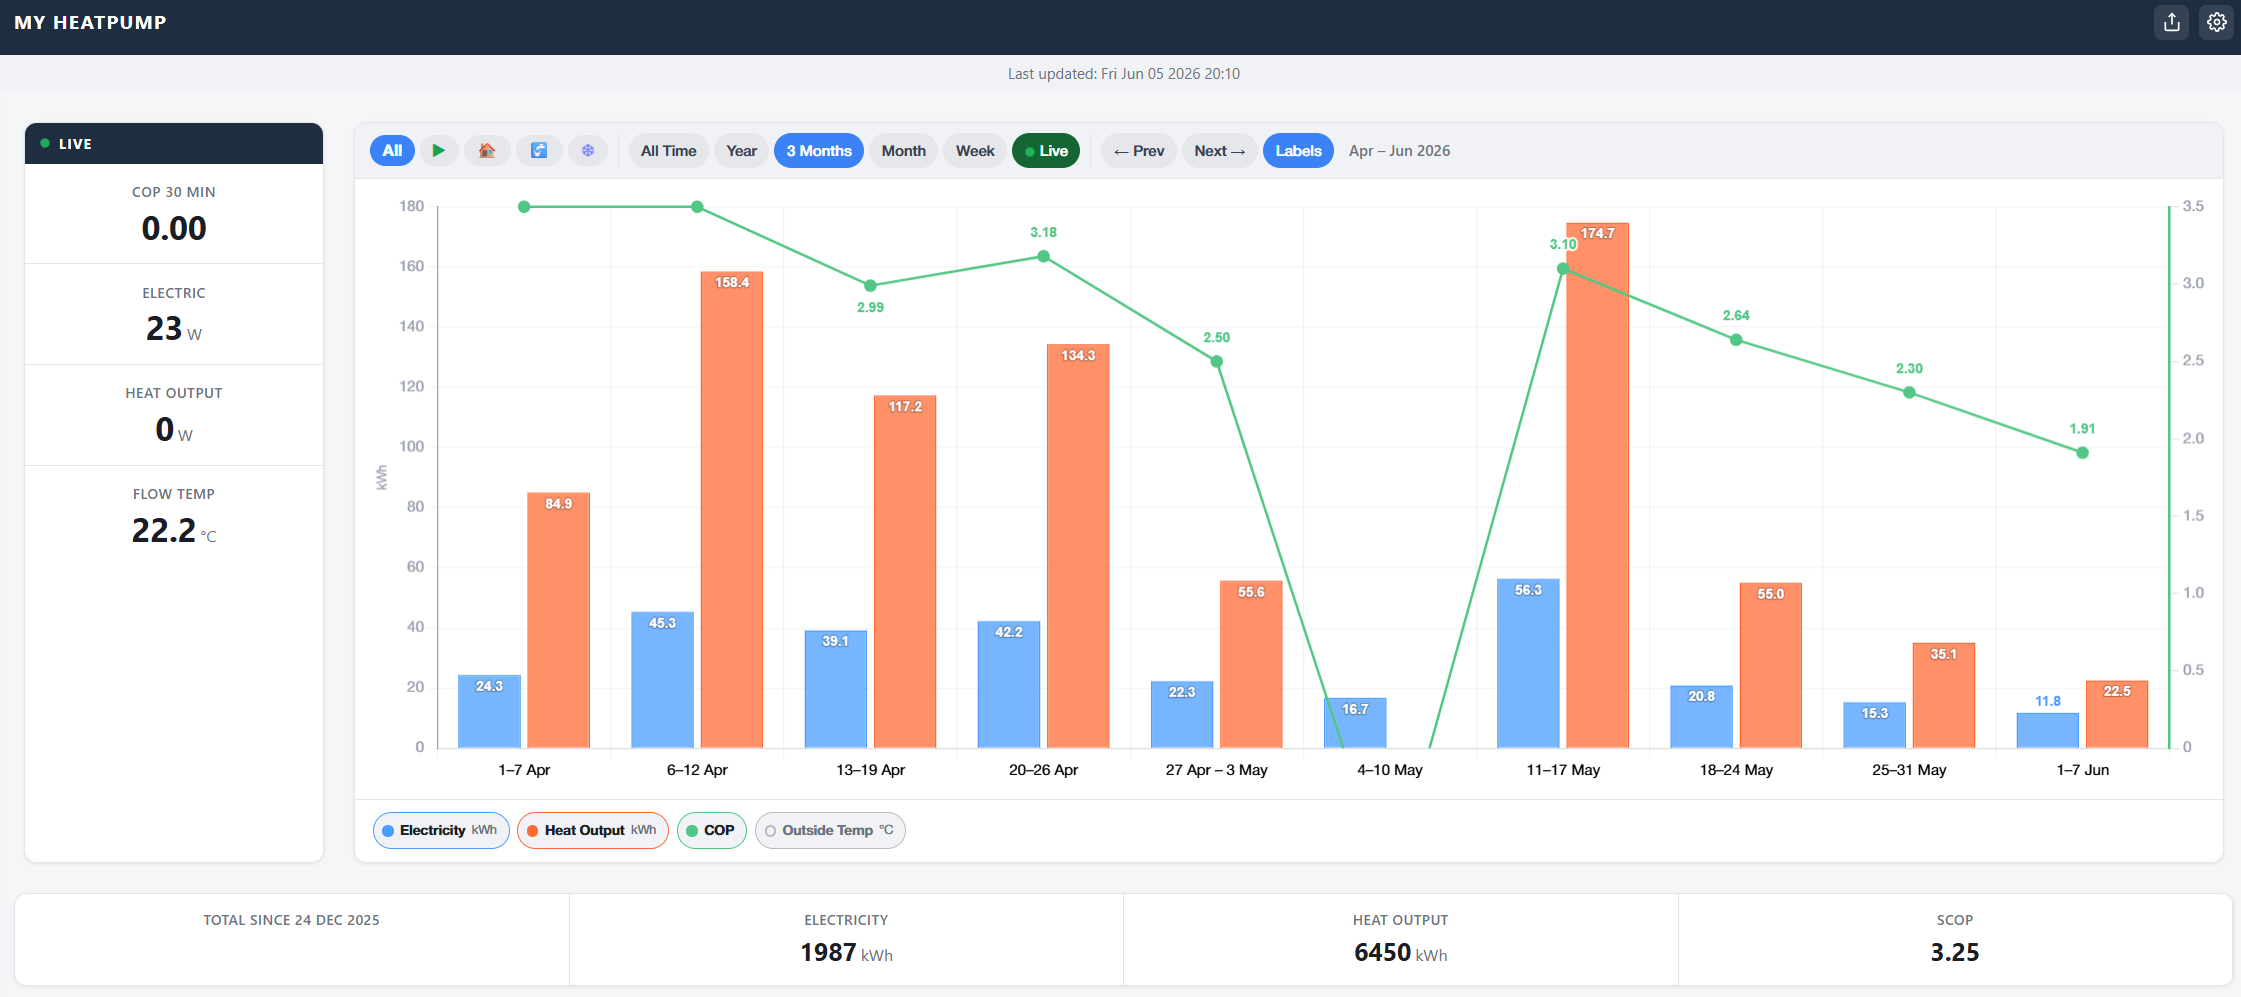
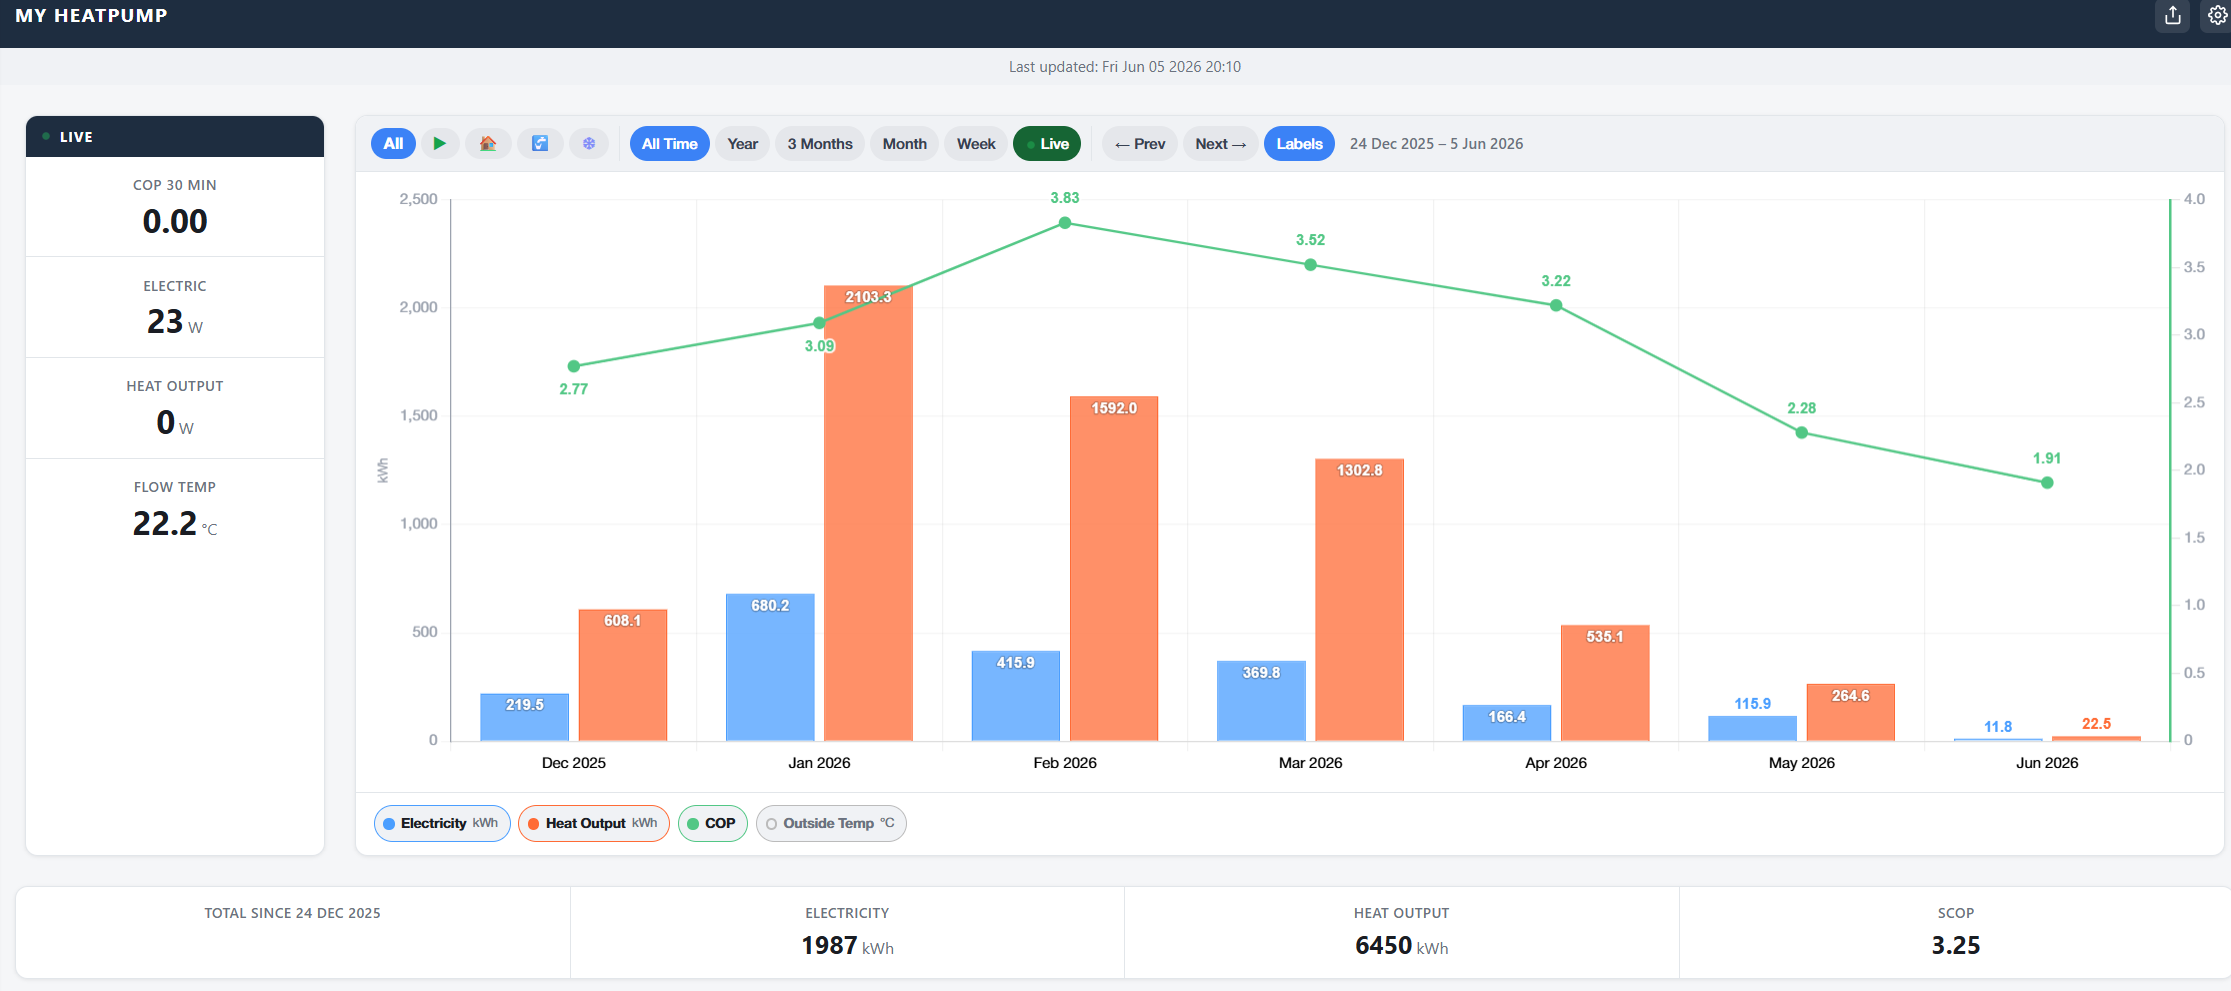
Bar chart
Weekly and monthly aggregation added — Year view shows 12 monthly bars, 3 Months shows weekly bars. Optional value labels on bars scale with the number of bars visible.
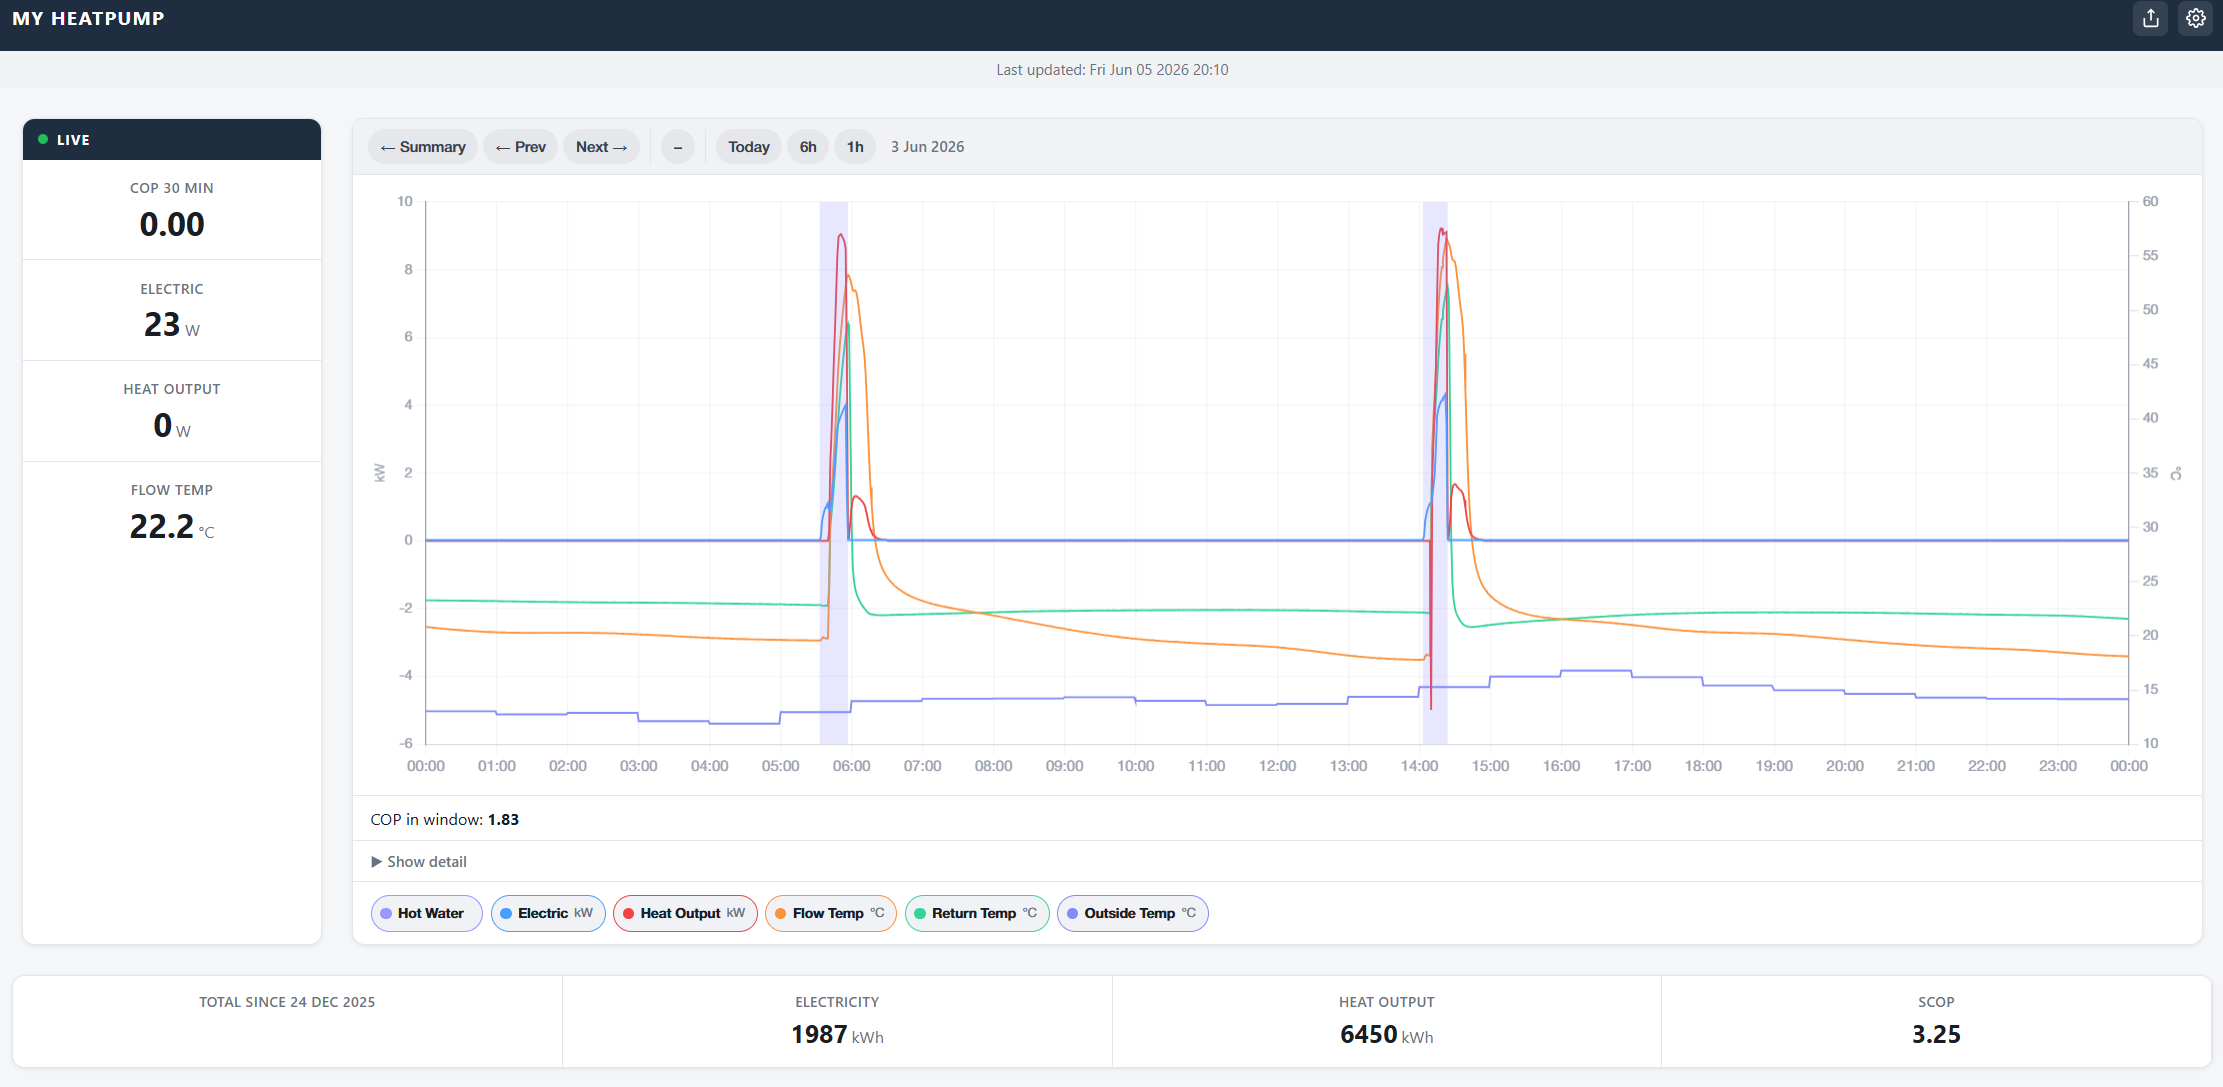
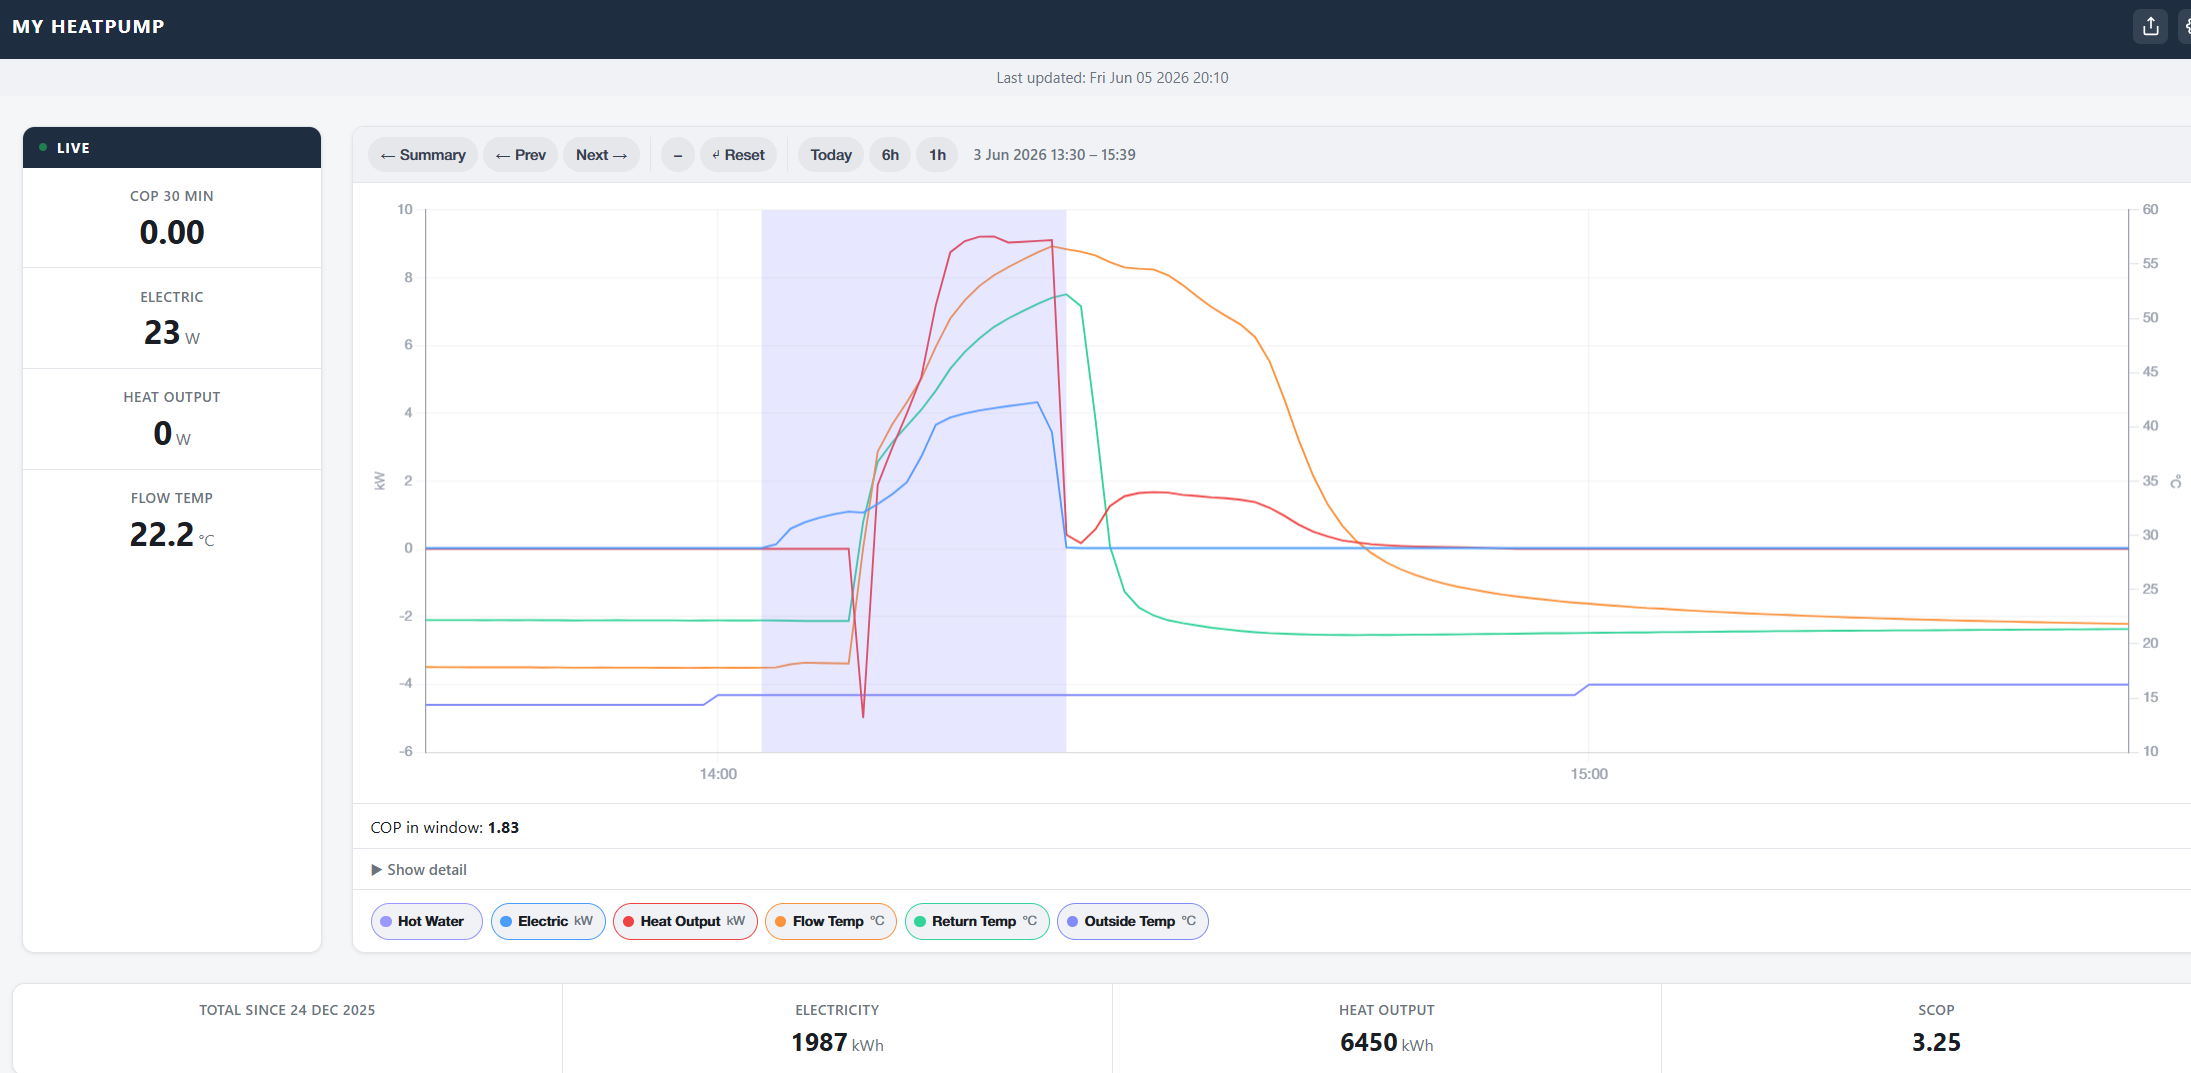
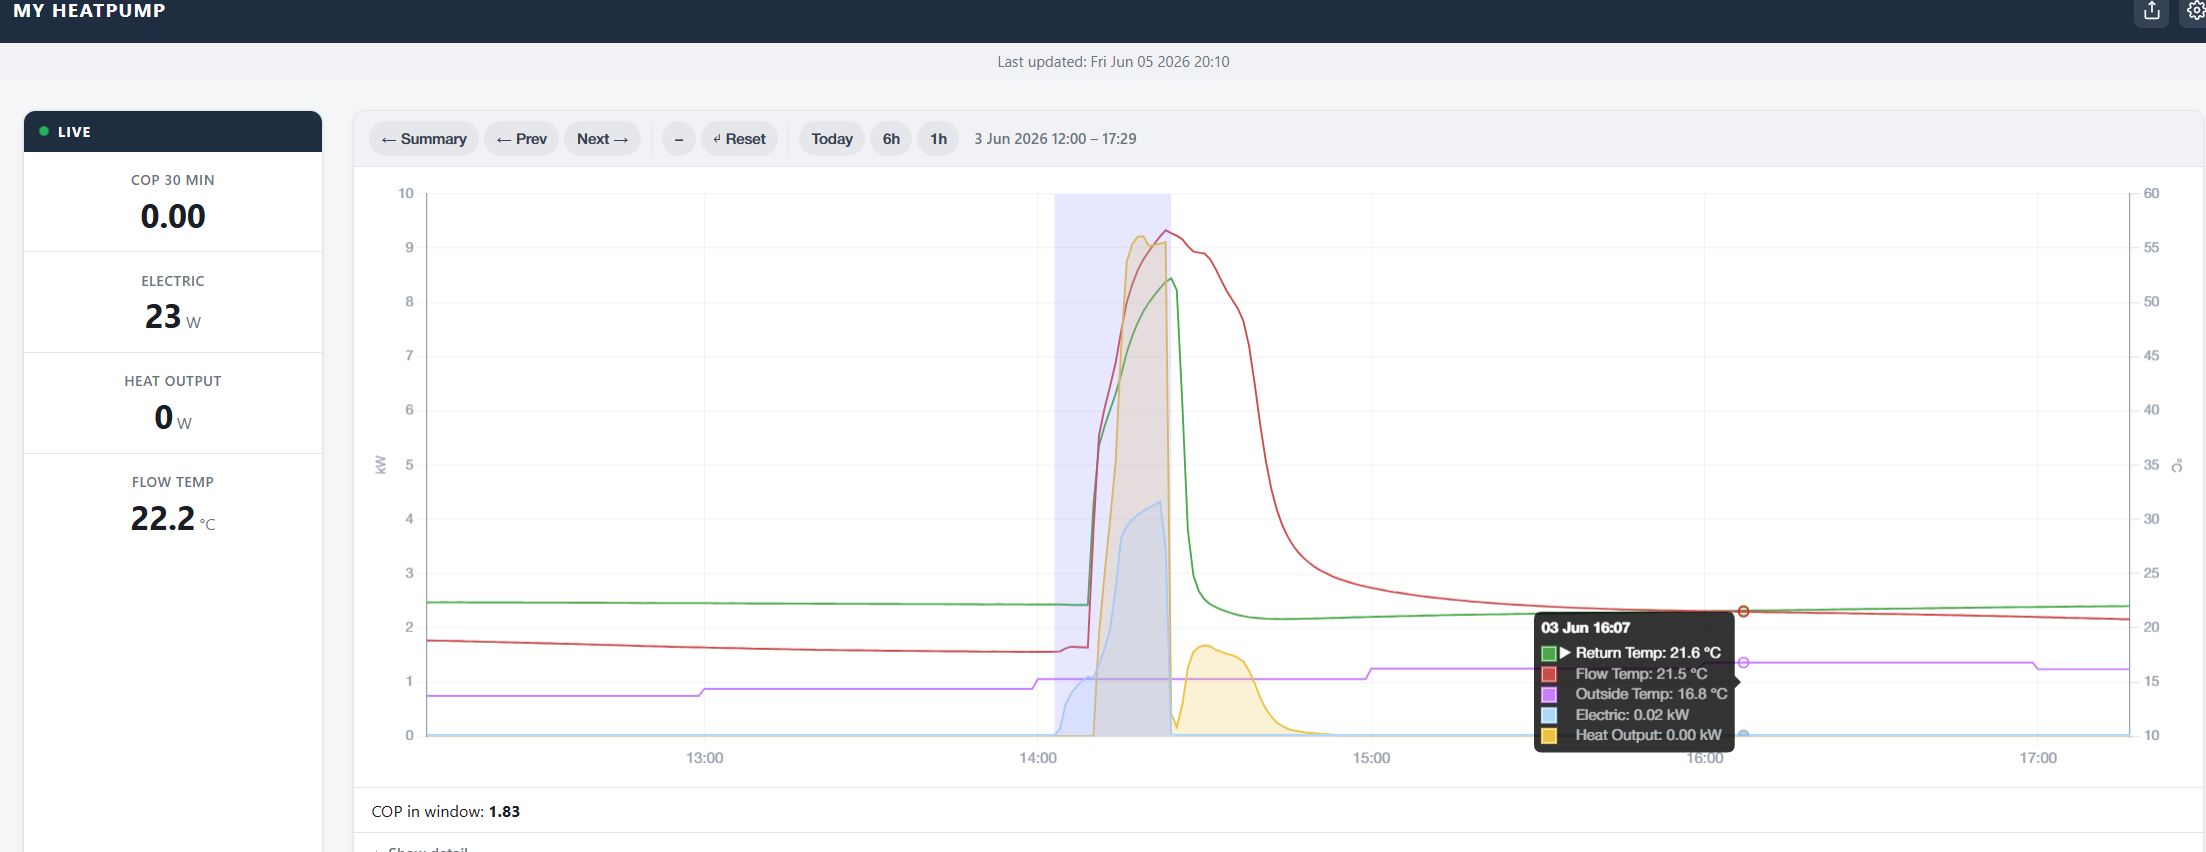
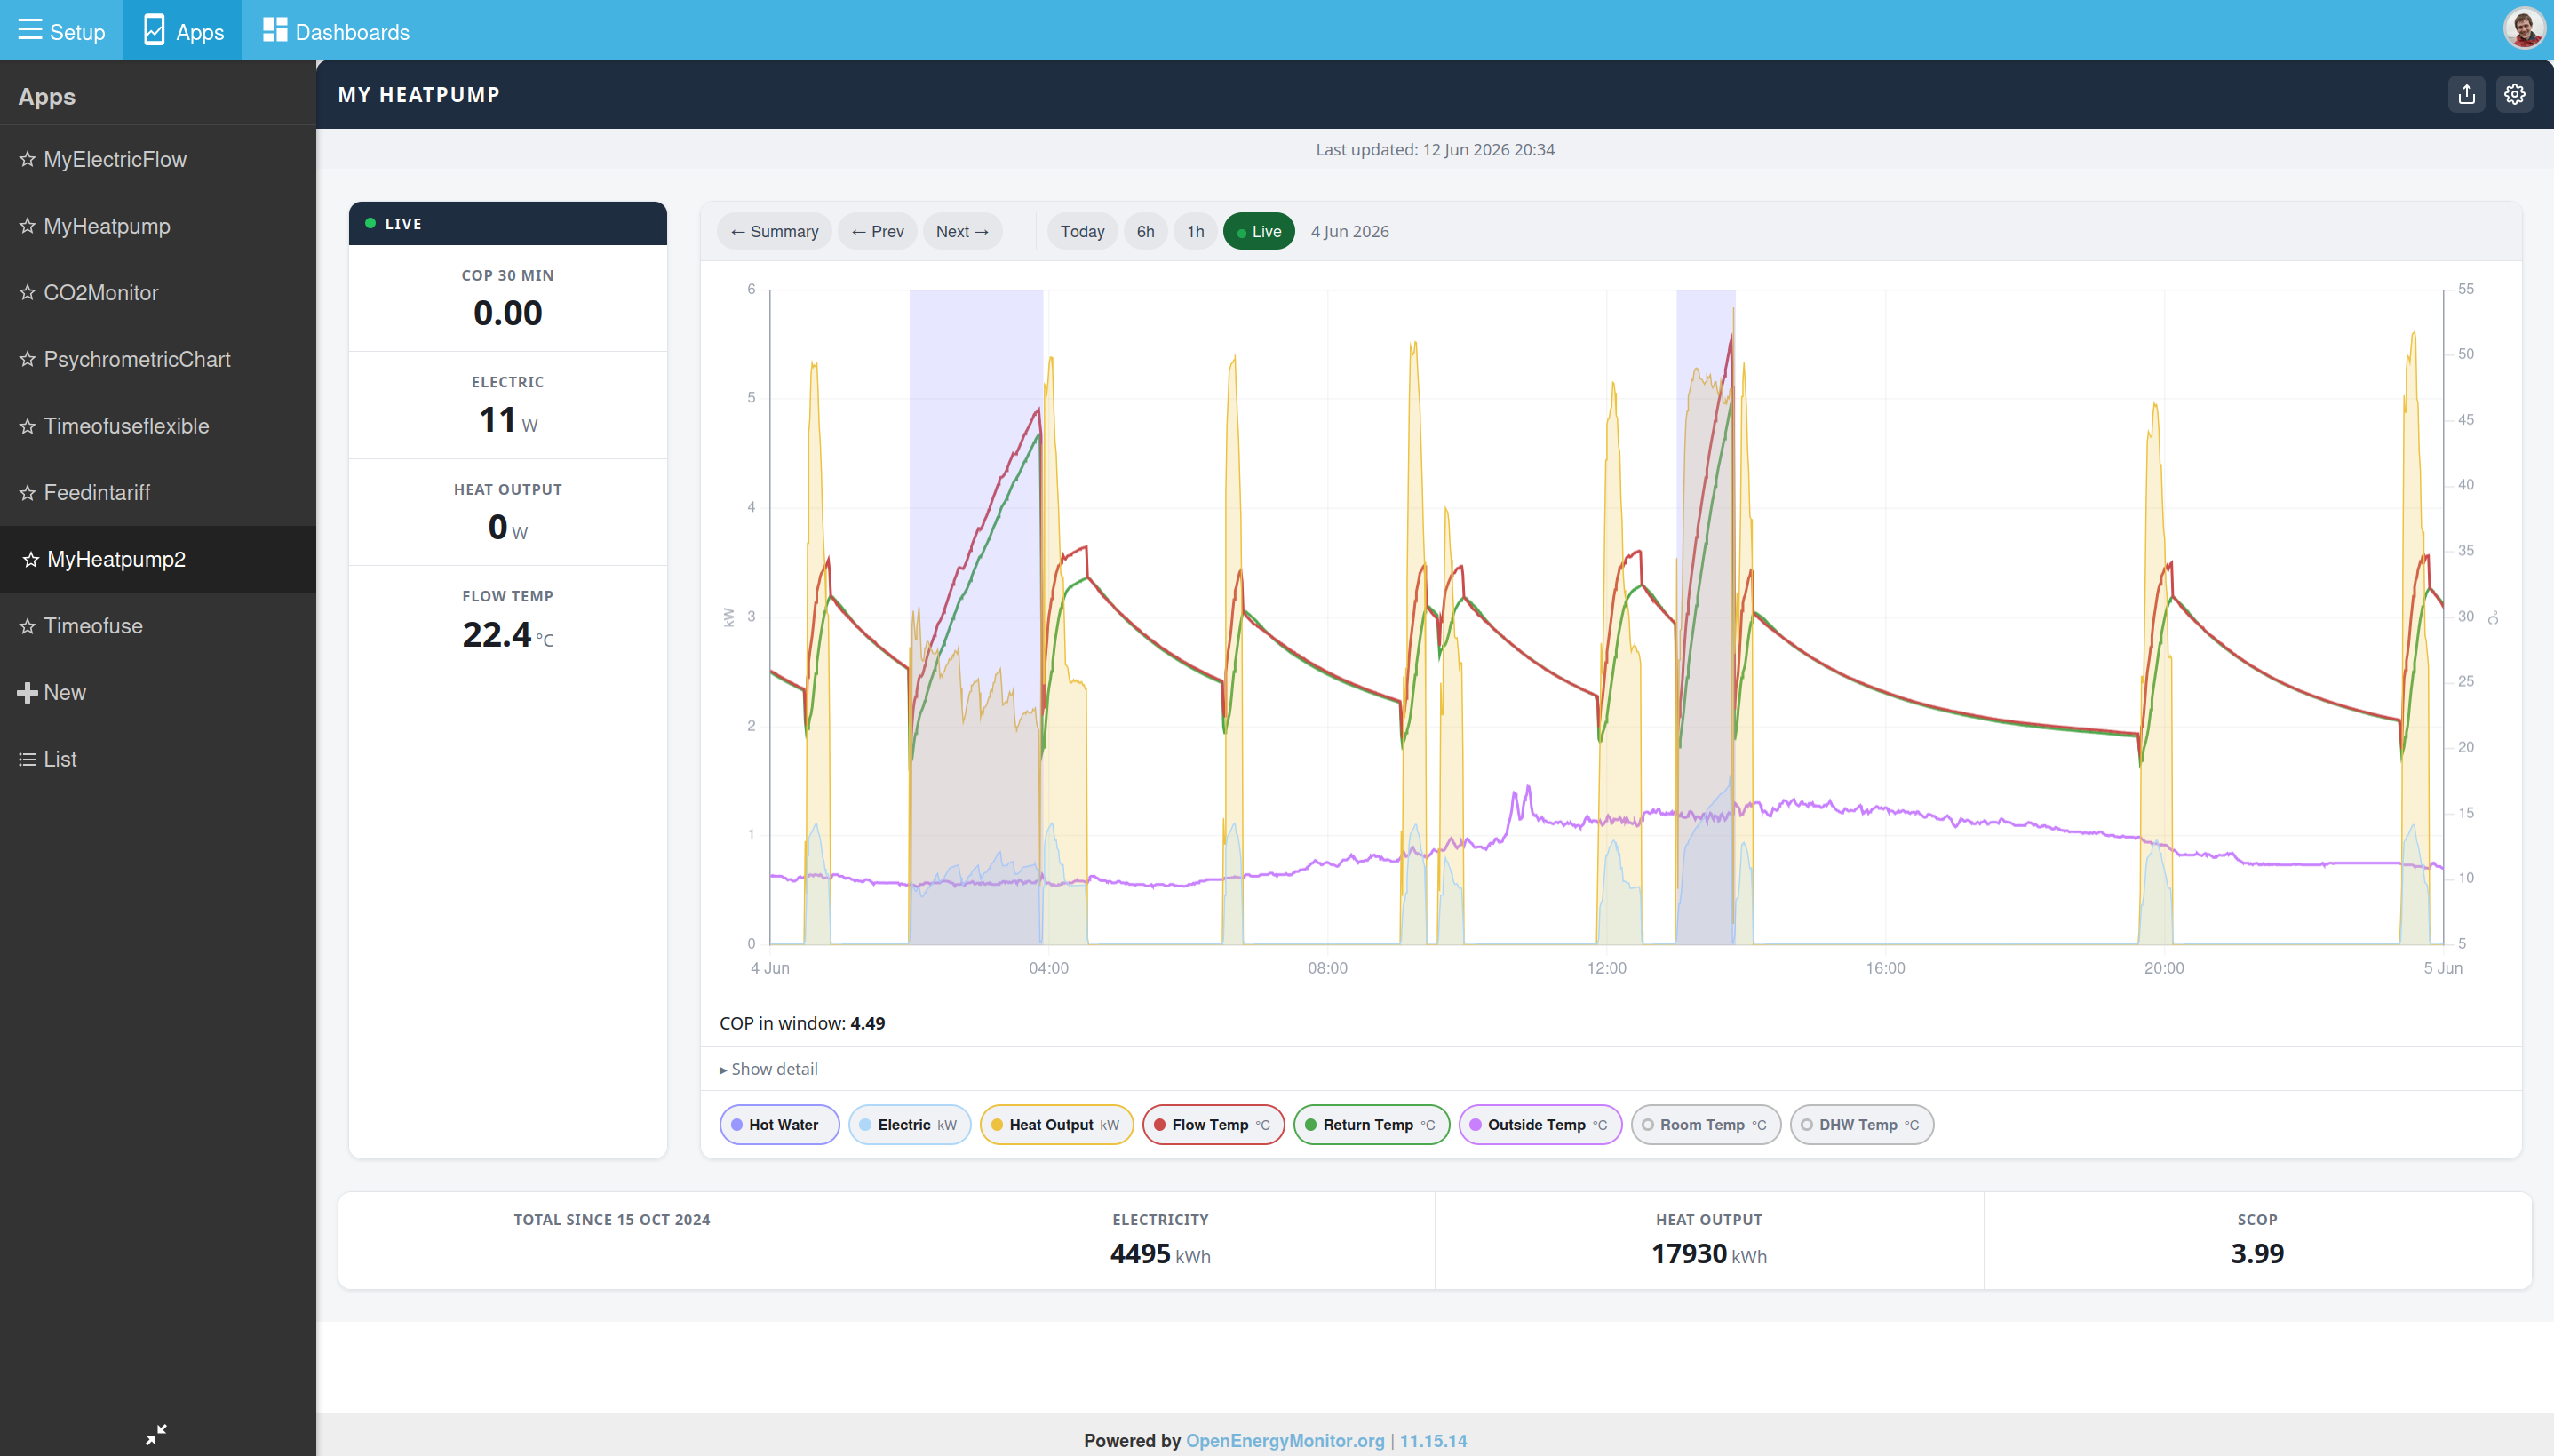
Power graph
Drag-to-zoom on desktop (draw a box over a DHW spike to zoom straight in), pinch-to-zoom on mobile/tablet. Time axis always snaps to clean round values. Tooltip highlights the nearest series to your cursor rather than showing a fixed list.

Visual
Responsive layout (mobile/tablet/desktop), automatic dark/light mode, adaptive axis styling, series toggles with clear on/off state.
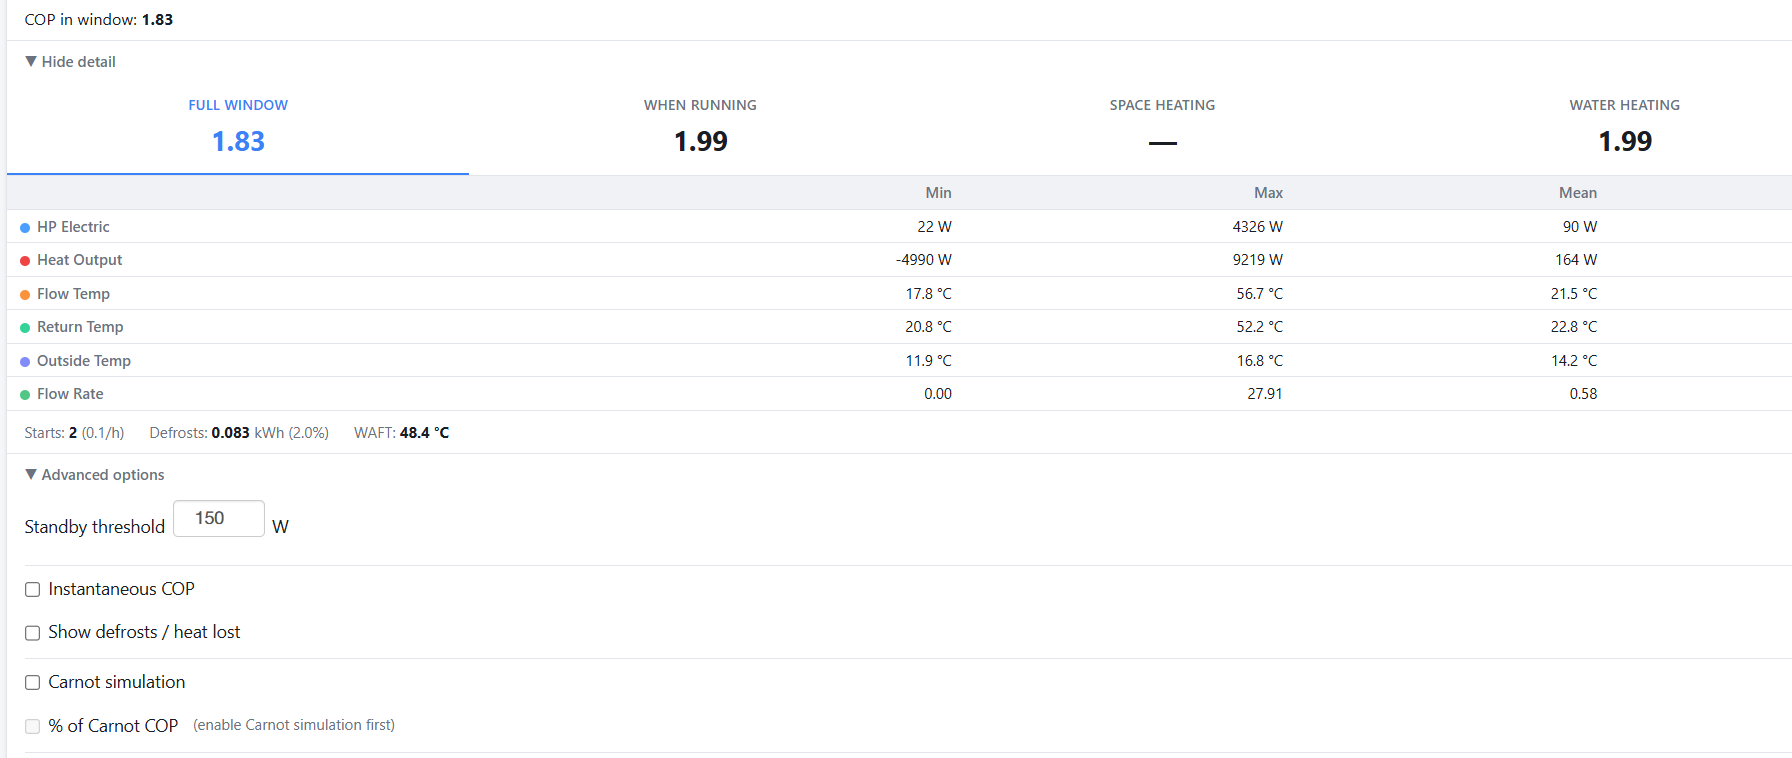
Detail section
Reorganised with COP mode tabs, a summary row (compressor starts, defrost energy, weighted average flow temp), and advanced overlays (Inst COP, Carnot simulation, % Carnot, defrosts) as off-by-default options.

Community comparison
Optional: enter your heatpumpmonitor.org system ID in the config to see your SCOP rank among public systems.


Still to add: emitter spec calculator and DHW standby heat loss coefficient from the original

Feedback welcome, see images below.

Thanks @morrisok, always great to see alternative suggestions, I also use Claude Code and other LLM tools and it’s nice that code becomes less precious in a sense, we can try and test new things that would have taken weeks of work in a few hours.

Interestingly a developer called Kevin Burke has been working on modernising Flot addressing many of the issues with the original library, removing the jquery dependency etc: GitHub - kevinburke/flot: Attractive JavaScript charts for jQuery · GitHub I’ve started using this newer version. The latest graph module shipped in stable uses it. I have also experimented with chart.js in recent months, Im not quite sold yet :sweat_smile: I need to spend more time experimenting with tweaks to get it to achieve the results Im after . If I can get it to look like Flot but just using a more actively developed library, I might be happy :grinning_face_with_smiling_eyes:. I do think that could be a possible route to adoption in Emoncms.

My first honest impressions looking at your screenshots are that the charts themselves look less clear than the current MyHeatpump dashboard. Im not such a fan of the monthly kWh electric and heat figures alongside each other rather than the way these are overlayed in the current dashboard. The power and temperature view is also less clear IMO. Could you ask Claude to create a concept that replicates the visual appearance of the current MyHeatpump charts, apply the same colour scheme but using chart.js..?

This looks like it’s running as standalone code? rather than inside emoncms? Can you share the code so it’s easy for others to test it?

Hi @TrystanLea , where should I upload it, I was going to raise a PR in the emoncms repository or I can host it in my own github.

Thanks for the feedback, I think its the shading underneath that my one is missing, Claude has updated it already see images below :slight_smile:. Being able to turn on and off some of the data is really useful if you want to focus on one or 2 data points though .

Nice! the data is now instantly recognizable. Yes Flot adds a subtle line shadow which I do quite like. It was actually removed in v5 of Flot and I have manually added it back into the latest Flot library in my copy of the library to get the same appearance :grinning_face_with_smiling_eyes:

It looks like while chart.js does not support line shadows natively it might be possible to implement via a custom plugin.

Zooming out a bit. I spent quite a bit of time in recent months trying to do a large ui update to Emoncms using tools such as Claude Design to assist, but what I found was that while it’s relatively easy to update one or two pages, it gets really complicated when you then need to carefully ensure that every page, every ui element is consistent. I was also mixing large css changes with javascript implementation changes such as upgrading to vue v3 etc.

I decided to row the amount of changes back a bit and focus on releasing mostly the javascript implementation upgrades first - keeping the old bootstrap v2 css framework in place, with the intention of coming back to the css framework side of things as a second stage.

Part of the issue with the current css side of things in Emoncms is that there is a big mix of bootstrap 2, bootstrap 4 utility classes and loads of custom styling as well - what I need to do first is unify and refactor all the existing css in a sensible way and then gradually modernise.

Here are a few concept designs from Claude Design that might be of interest, these could possibly be used as part of your prompts to see what a heat pump dashboard that followed a similar design style might look like?

I can share the code for this concept if useful.

Hi @TrystanLea ,

Uploaded my dashboard to here. Happy to update it to follow some of the look and feel of the images but the controls is what I have worked on to make more user friendly.

Whats the next step, how can I get it from where it is, to something I can have hosted and using live data? I’ve included a whole testing plan (both automated and manual) to aid.

Thanks @morrisok. I’ve got this running here:

I like the feature to toggle on/off each series from the legend. I’d be happy to incorporate that in the existing MyHeatpump dashboard, but I would prefer not to merge in or host alongside the rest for now. As I mentioned above I’m working towards larger UI changes in Emoncms at the moment - and part of that will include refining things like dashboard button styles, so the time will come to make progress on that side of things soon.

Happy to jump on a call sometime next week to discuss this and future development. Please send me a PM and we can arrange a time if that suits you.