Hi all
Aim:
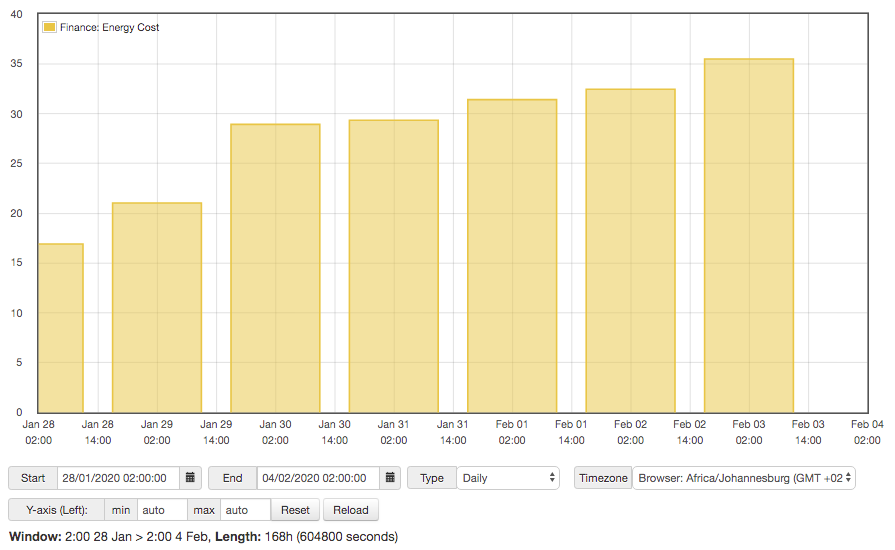
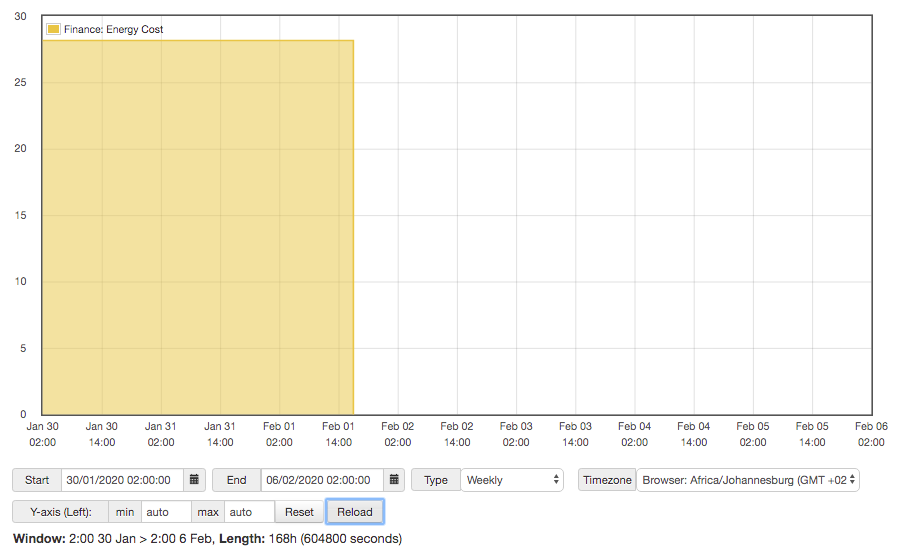
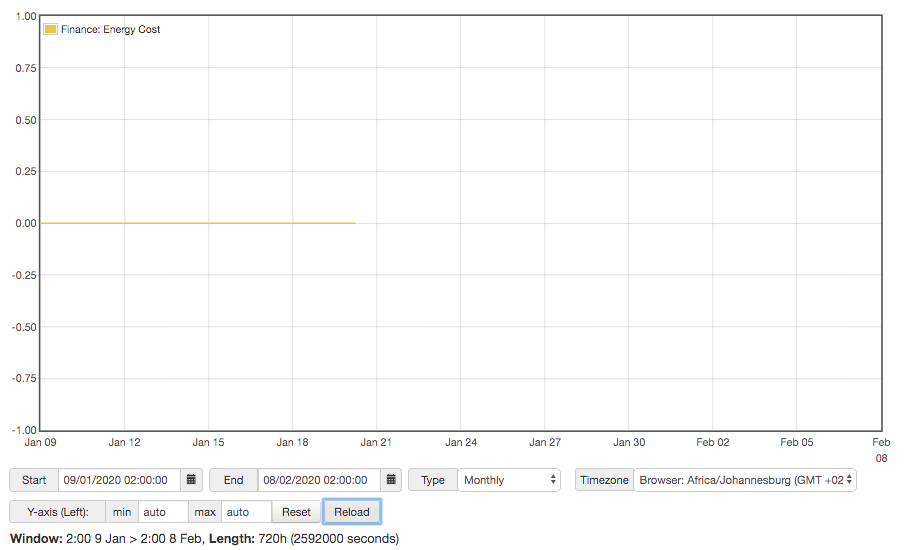
I would like to create a simple cumulative cost graph (in Rands) that “resets” every month.
Problem:
The daily and weekly graphs work but not the monthly interval one.
Example images:
See Daily, Weekly and Monthly images
Specs:
EmonCMS local on emonbase.
Methodology:
I created a power to energy feed and then created a virtual feed to represent the energy costs. I used: Energy cost (R/kWh) = 1.5 (R/kWh) x Energy (kWh).
Dataspan:
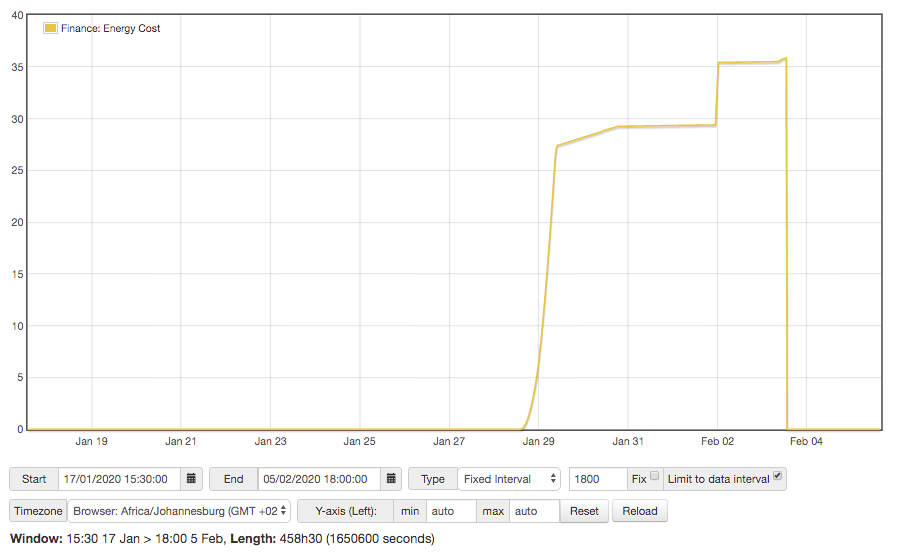
2020-01-28 16:26:35 till current (see image).
Questions:
- Does the monthly graph not display because I don’t have enough data to represent? Aka my captured data is not enough to span over a month interval (yet)?
- If so, how can I enable it to show costs already undergone for this month while incrementing and not have to wait till the end of the month to show?
Thanks in andvance.