I’ve been writing up annual updates on the monitoring results for my air source heat pump now for several years, publishing on my blog. I recently updated the blog with my 2021 results as well as results for 2022 to date. All monitored using OpenEnergyMonitor kit of course I’ve been meaning to post this up here for a while, I know quite a few here have already seen all this…
The headline figure is a SCOP (seasonal coefficient of performance) of 3.96 in 2019, 3.91 in 2020 and 4.04 in 2021. Here are the annual results with discussion in a lot more detail:
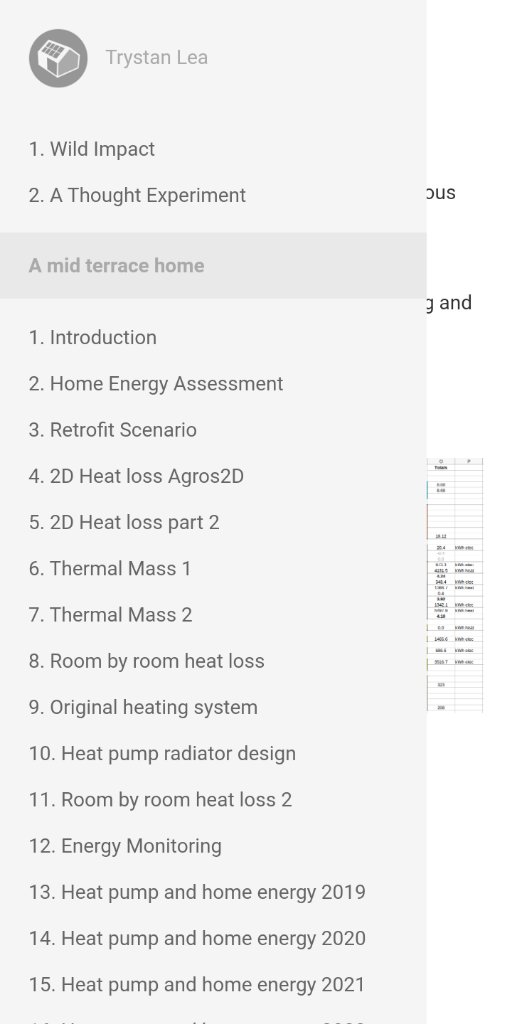
This is what the heat pump looks like at the back of the house, the house is a mid-terrace stone house without much insulation (see the blog posts for details on this):
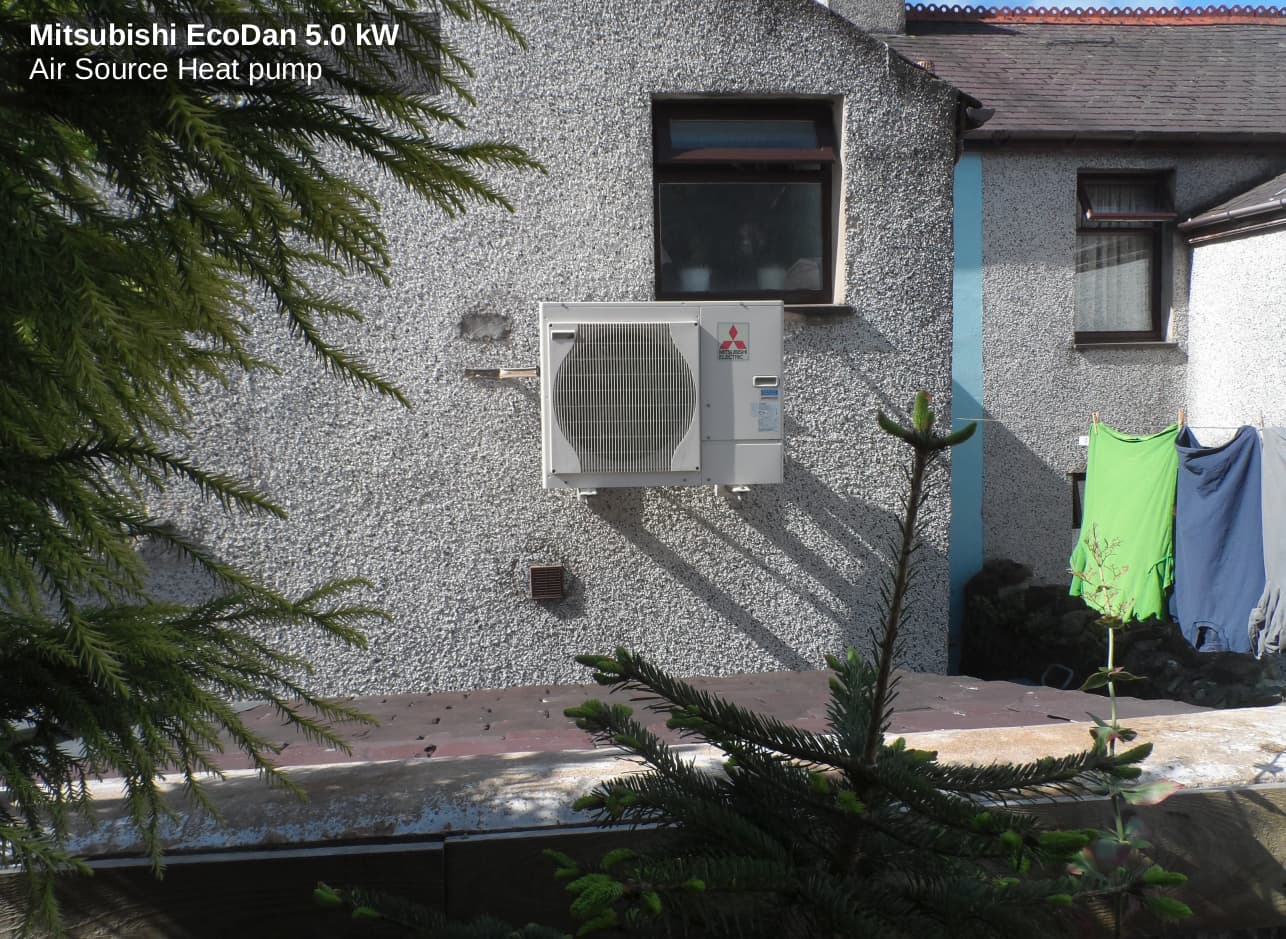
The system is configured as a single open circuit with all TRV’s fully open, the radiators have been carefully designed to provide the right temperature in each room and it’s a small house with all rooms in use and so is a configuration that makes sense in our context.
There is no low loss header or buffer which removes the efficiency penalty that can result from water mixing in the buffer as well as reducing the number of pumps required to just the one pump. The Wilo pico central heating pump is also a low energy pump, consuming only about 11W when running.
Heat pump monitor app
I put a video together to demo the Emoncms heat pump monitor app last September, that shows data from the system, giving a good idea of what this looks like when it is running:
and here’s a video discussing the heat pump installation itself in a bit more detail:
Hello @mjr sorry about that, does the nav not disappear for you after a few seconds? If it does not what happens if you click on the house icon at the top? does that hide the menu?
Privacy browser. Yes, JavaScript permission denied to untrusted websites for security, privacy, battery and accessability. Shouldn’t it at least display cleanly without it? I only want to read it, not interact. Show/hide menus only need CSS anyway.
Tryson, thanks for posting such a detailed study
I’m considering a heat pump for my newbuild
One concern I have is the slow ramp up because of the low temperature output, so the HP has to be operating for longer, leading to greater losses through the insulation
I note you compared the cost of delivered heat to the house from the HP v cost of doing the same with gas (let’s assume “normal” prices, the market is nuts at the mo)
However with the slow ramp up, more heat would have to be delivered to the house, as the duration is longer.
How many kWh of gas per year were used in the years before fitting the HP? To compare with how many kWh post HP fitting. That would give a closer to realworld COP
Trystan’s house did not use gas - the central heating system was fed by a solid fuel stove with a back-boiler. He only lived in it for a few months, perhaps a year, before he fitted the heat-pump.
Yes a valid question and unfortunately I don’t have that before and after data to be able to say. I’d probably need a good number of years of data as well as my annual consumption with the heat pump has changed significantly year after year, partly increasing comfort, partly mild winters.
@TrystanLea Firstly, thank you. This is a treasure trove of information. We’re in our first year with our Ecodan and I’m planning to add monitoring when the TXv4s are available.
Do you happen to have a summary of your current settings for the Ecodan? I’m confident that we need to tweak some things but couldn’t find this on the site. I see snippets of information but if you happen to have anything consolidated, that works be fantastic.
Hello @abbbbbottttt I have a FTC2b controller which is designed for integration with building management systems. I control that with an raspberryPi, which sets the water flow temperature desired. I control heat pump start, stop and diverter valve position (space heating/DHW) from the pi. This does make my setup a little difficult to transfer directly to standard Ecodan settings.
Does your Ecodan measure energy consumed and produced? do you have an insight into it’s performance so far? What kind of heat emitters do you have? zones? low loss header? Hot water settings? Are you using weather comp with 3rd party thermostats or the main controller as your central thermostat allowing the use of auto adapt?
@TrystanLea - Thanks for your reply. Understood on your setup and we’re on the FTC6 and we have limited information currently through MEL Cloud. My plan is to take that information and combine it with TX info in Emoncms.
I can’t easily get at the figures to calculate COP at the moment but I am still digging on what I is possible. We’ve had new K2 radiators installed throughout but a single zone. We’ve currently got two standalone thermostats and I switch from downstairs to upstairs later in the day.
I don’t think the unit was particularly well configured when installed and was set on Flow. As I say, I’ve changed to Room but everything I read suggests Curve is the most optimal. We’re hardly using it with the current weather so gearing myself up for winter and the next lot of energy price rises.
Hi @TrystanLea. I’m looking for a professional to carry out my heat loss calculations for an ASHP and would like to have a monitoring system. Is this something that you could do or recommend some one who could carry this out. I’m based near Llangollen
Ryan
@TrystanLea Whilst I await the new TX, I see on another thread that you had data being pulled from MEL Cloud. I’ve got data but am struggling with the units for energy monitoring. Do you have any idea what units and what you did to get it in shape?
The data in MELCloud is useful, but it’s not perfect. Fields in the User/ListDevices JSON such as HeatingEnergyConsumedRate1 used to give you the Wh in the last minute. Unfortunately that stopped working last November. As it happens I’m trying to find my way inside Mitsubishi to see if we can get this repaired, but don’t hang around waiting for that to bear fruit.
These days I’m looking at the "EnergyCost/Report" JSON and doing a diff between the latest figure and the previous one. For example the code looks at:
directions = ["Consumed", "Produced"]
operations = ["Heating", "HotWater"]

for direction in directions:
    for operation in operations:
        combined = operation + direction
        total = "Total" + combined
So that combinations gives me four different energy stats.
I think some people use pymelcloud, or you could try just hitting the HTTP endpoints directly. All will become clear if you watch the MELCloud website interaction with the server using your browser’s developer tools.

")