Hello,
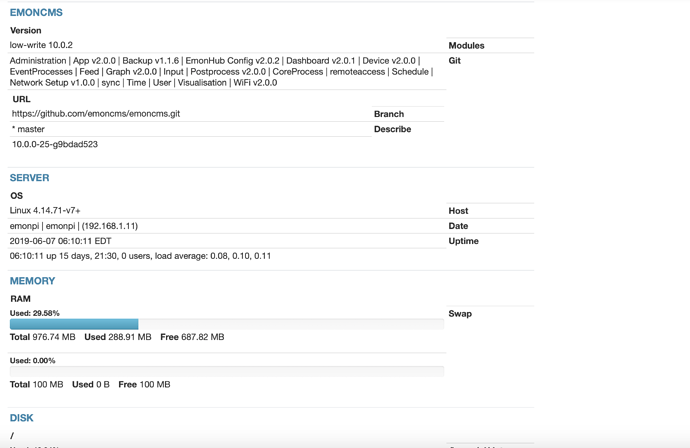
Since I upgraded to 10.0.2 I’ve noticed a misalignment of what is displayed in the Admin screen which makes it difficult to read. It’s not a big issue for me, I just wanted to point it out to see if it’s just my system or if others are experiencing the same issue.
Server Information
Server Information
Services
- emonhub :- Active Running
- emoncms_mqtt :- Active Running
- feedwriter :- Active Running - sleep 60s 56 feed points pending write
- service-runner :- Active Running
- emonPiLCD :- Active Running
- redis-server :- Active Running
- mosquitto :- Active Running
Emoncms
- Version :- low-write 10.0.2
- Modules :- Administration | App v2.0.0 | Backup v1.1.6 | EmonHub Config v2.0.2 | Dashboard v2.0.1 | Device v2.0.0 | EventProcesses | Feed | Graph v2.0.0 | Input | Postprocess v2.0.0 | CoreProcess | remoteaccess | Schedule | Network Setup v1.0.0 | sync | Time | User | Visualisation | WiFi v2.0.0
-
Git :-
- URL :- GitHub - emoncms/emoncms: Web-app for processing, logging and visualising energy, temperature and other environmental data
- Branch :- * master
- Describe :- 10.0.0-25-g9bdad523
Server
- OS :- Linux 4.14.71-v7+
- Host :- emonpi | emonpi | (192.168.1.11)
- Date :- 2019-06-07 06:10:11 EDT
- Uptime :- 06:10:11 up 15 days, 21:30, 0 users, load average: 0.08, 0.10, 0.11
Memory
-
RAM :- Used: 29.58%
- Total :- 976.74 MB
- Used :- 288.91 MB
- Free :- 687.82 MB
-
Swap :- Used: 0.00%
- Total :- 100 MB
- Used :- 0 B
- Free :- 100 MB
Disk
-
/ :- Used: 42.34%
- Total :- 3.81 GB
- Used :- 1.62 GB
- Free :- 2.02 GB
-
/home/pi/data :- Used: 1.70%
- Total :- 10.32 GB
- Used :- 179.89 MB
- Free :- 9.62 GB
-
/boot :- Used: 51.69%
- Total :- 42.52 MB
- Used :- 21.98 MB
- Free :- 20.54 MB
-
/mnt/usbdrive :- Used: 0.27%
- Total :- 28.97 GB
- Used :- 80.19 MB
- Free :- 27.39 GB
HTTP
- Server :- Apache/2.4.25 (Raspbian) HTTP/1.1 CGI/1.1 80
MySQL
- Version :- 5.5.5-10.1.23-MariaDB-9+deb9u1
- Host :- localhost:6379 (127.0.0.1)
- Date :- 2019-06-07 06:10:11 (UTC -04:00)
- Stats :- Uptime: 1373448 Threads: 3 Questions: 1083115 Slow queries: 0 Opens: 45 Flush tables: 1 Open tables: 39 Queries per second avg: 0.788
Redis
- Version :- 3.2.6
- Host :- localhost:6379
- Size :- 238 keys (813.33K)
- Uptime :- 15 days
MQTT Server
- Version :- Mosquitto 1.4.10
- Host :- localhost:1883 (127.0.0.1)
PHP
- Version :- 7.0.30-0+deb9u1 (Zend Version 3.0.0)
- Modules :- apache2handler | calendar v7.0.30-0+deb9u1 | Core v7.0.30-0+deb9u1 | ctype v7.0.30-0+deb9u1 | curl v7.0.30-0+deb9u1 | date v7.0.30-0+deb9u1 | dom v20031129 | exif v7.0.30-0+deb9u1 | fileinfo v1.0.5 | filter v7.0.30-0+deb9u1 | ftp v7.0.30-0+deb9u1 | gd v7.0.30-0+deb9u1 | gettext v7.0.30-0+deb9u1 | hash v1.0 | iconv v7.0.30-0+deb9u1 | igbinary v2.0.1 | json v1.4.0 | libxml v7.0.30-0+deb9u1 | mbstring v7.0.30-0+deb9u1 | mcrypt v7.0.30-0+deb9u1 | mosquitto v0.4.0 | mysqli v7.0.30-0+deb9u1 | mysqlnd vmysqlnd 5.0.12-dev - 20150407 - $Id: b5c5906d452ec590732a93b051f3827e02749b83 $ | openssl v7.0.30-0+deb9u1 | pcre v7.0.30-0+deb9u1 | PDO v7.0.30-0+deb9u1 | pdo_mysql v7.0.30-0+deb9u1 | Phar v2.0.2 | posix v7.0.30-0+deb9u1 | readline v7.0.30-0+deb9u1 | redis v4.1.1 | Reflection v7.0.30-0+deb9u1 | session v7.0.30-0+deb9u1 | shmop v7.0.30-0+deb9u1 | SimpleXML v7.0.30-0+deb9u1 | sockets v7.0.30-0+deb9u1 | SPL v7.0.30-0+deb9u1 | standard v7.0.30-0+deb9u1 | sysvmsg v7.0.30-0+deb9u1 | sysvsem v7.0.30-0+deb9u1 | sysvshm v7.0.30-0+deb9u1 | tokenizer v7.0.30-0+deb9u1 | wddx v7.0.30-0+deb9u1 | xml v7.0.30-0+deb9u1 | xmlreader v7.0.30-0+deb9u1 | xmlwriter v7.0.30-0+deb9u1 | xsl v7.0.30-0+deb9u1 | Zend OPcache v7.0.30-0+deb9u1 | zlib v7.0.30-0+deb9u1
Pi
- Model :- Raspberry Pi 3 Model B+ Rev 1.3 - 1 GB (Sony UK)
- SoC :- Broadcom BCM2835
- Serial num. :- 5ABE4EF9
- Temperature :- 51.00°C - 51.0°C
- emonpiRelease :- emonSD-30Oct18
- File-system :- read-write
