Hello
I’ve been reviewing the data on this forum and it’s associated emoncms forum for an MSC project and I thought this might interest you…
If you take all the Issues threads in the github forum and plot the respective to tag and date you can create something like this graph…
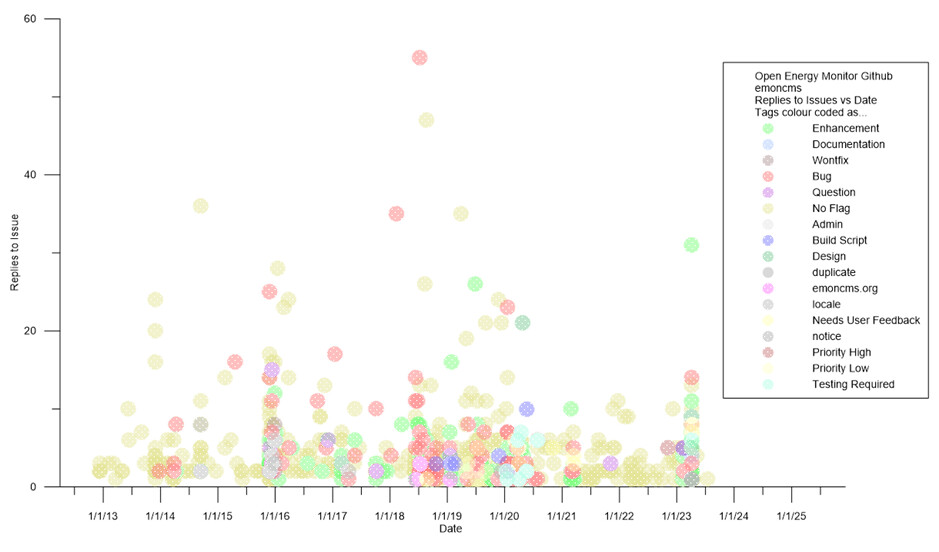
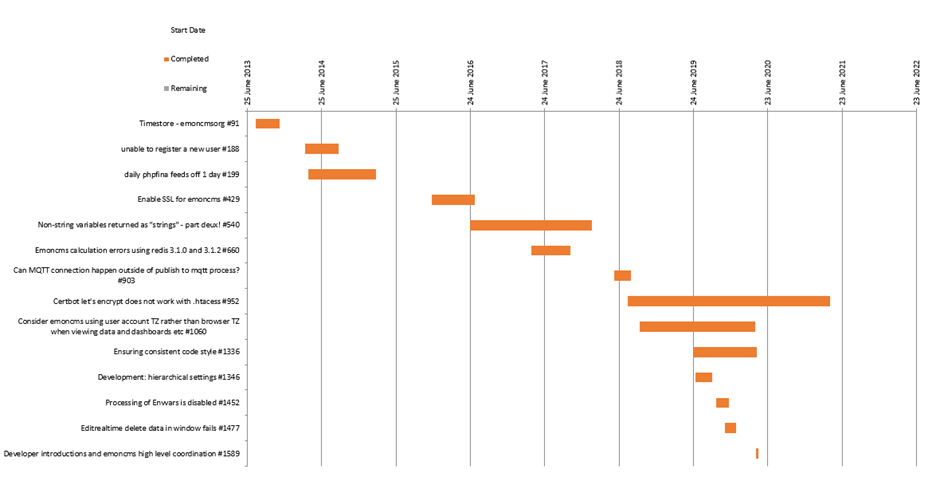
The most populous tags are Enhancements (green), and Bugs (red) and you can kind of see a pattern of development phases. Although the dates used to make this graph tend to correlate to the end time of an issue thread not the start … to get a better view of the overall trends requires manually transcribing the start and end dates of Issues threads from the threads … time consuming…but limiting manual data capture to only those threads with the most replies (20 or over) you can kind of produce a gantt chart like this one of github issues vs date
Or if you just do the bugs

The most significant bug Issue seems to be “duplicated inputs” which you were trying to fix with the preg_replace function …
There are the kind of issues that one would expect to come up such as the casting issues, floating point rounding errors …and also quite a lot of issues caused by PHP forward/backward compatibility problems between versions
Byte Storage Transfer Issues “Corrupt Metadata in timestore after import_full.php and restart” was an interesting problem - innovate solution
Changing from MySQL to Redis to extend life of SD card seems to have created a lot of problems. It shows how testing in the field gives different results than one might expect… I was wondering if at the start you considered any combination of Static testing, White box testing, Grey box testing, Black box testing ? etc
One wonders if you use any software design patterns or an agile methodology?
There are other patterns in your project similar to the others - such as attempts to use pauses as a quick fix to solve problems where there are timing errors due to data transfer…
Anyway … thought it might interest you…