I have a bit of an issue with using Virtual Feeds.
I have the standard feed (connected to power1 on the EmonPi) which records the total consumption, and a second feed which (as of last week) records the EV consumption (connected to power2 on the EmonPi).
I’ve trying to create a virtual feed that substracts EV from total, in order to get the house consumption.
This seems to work:

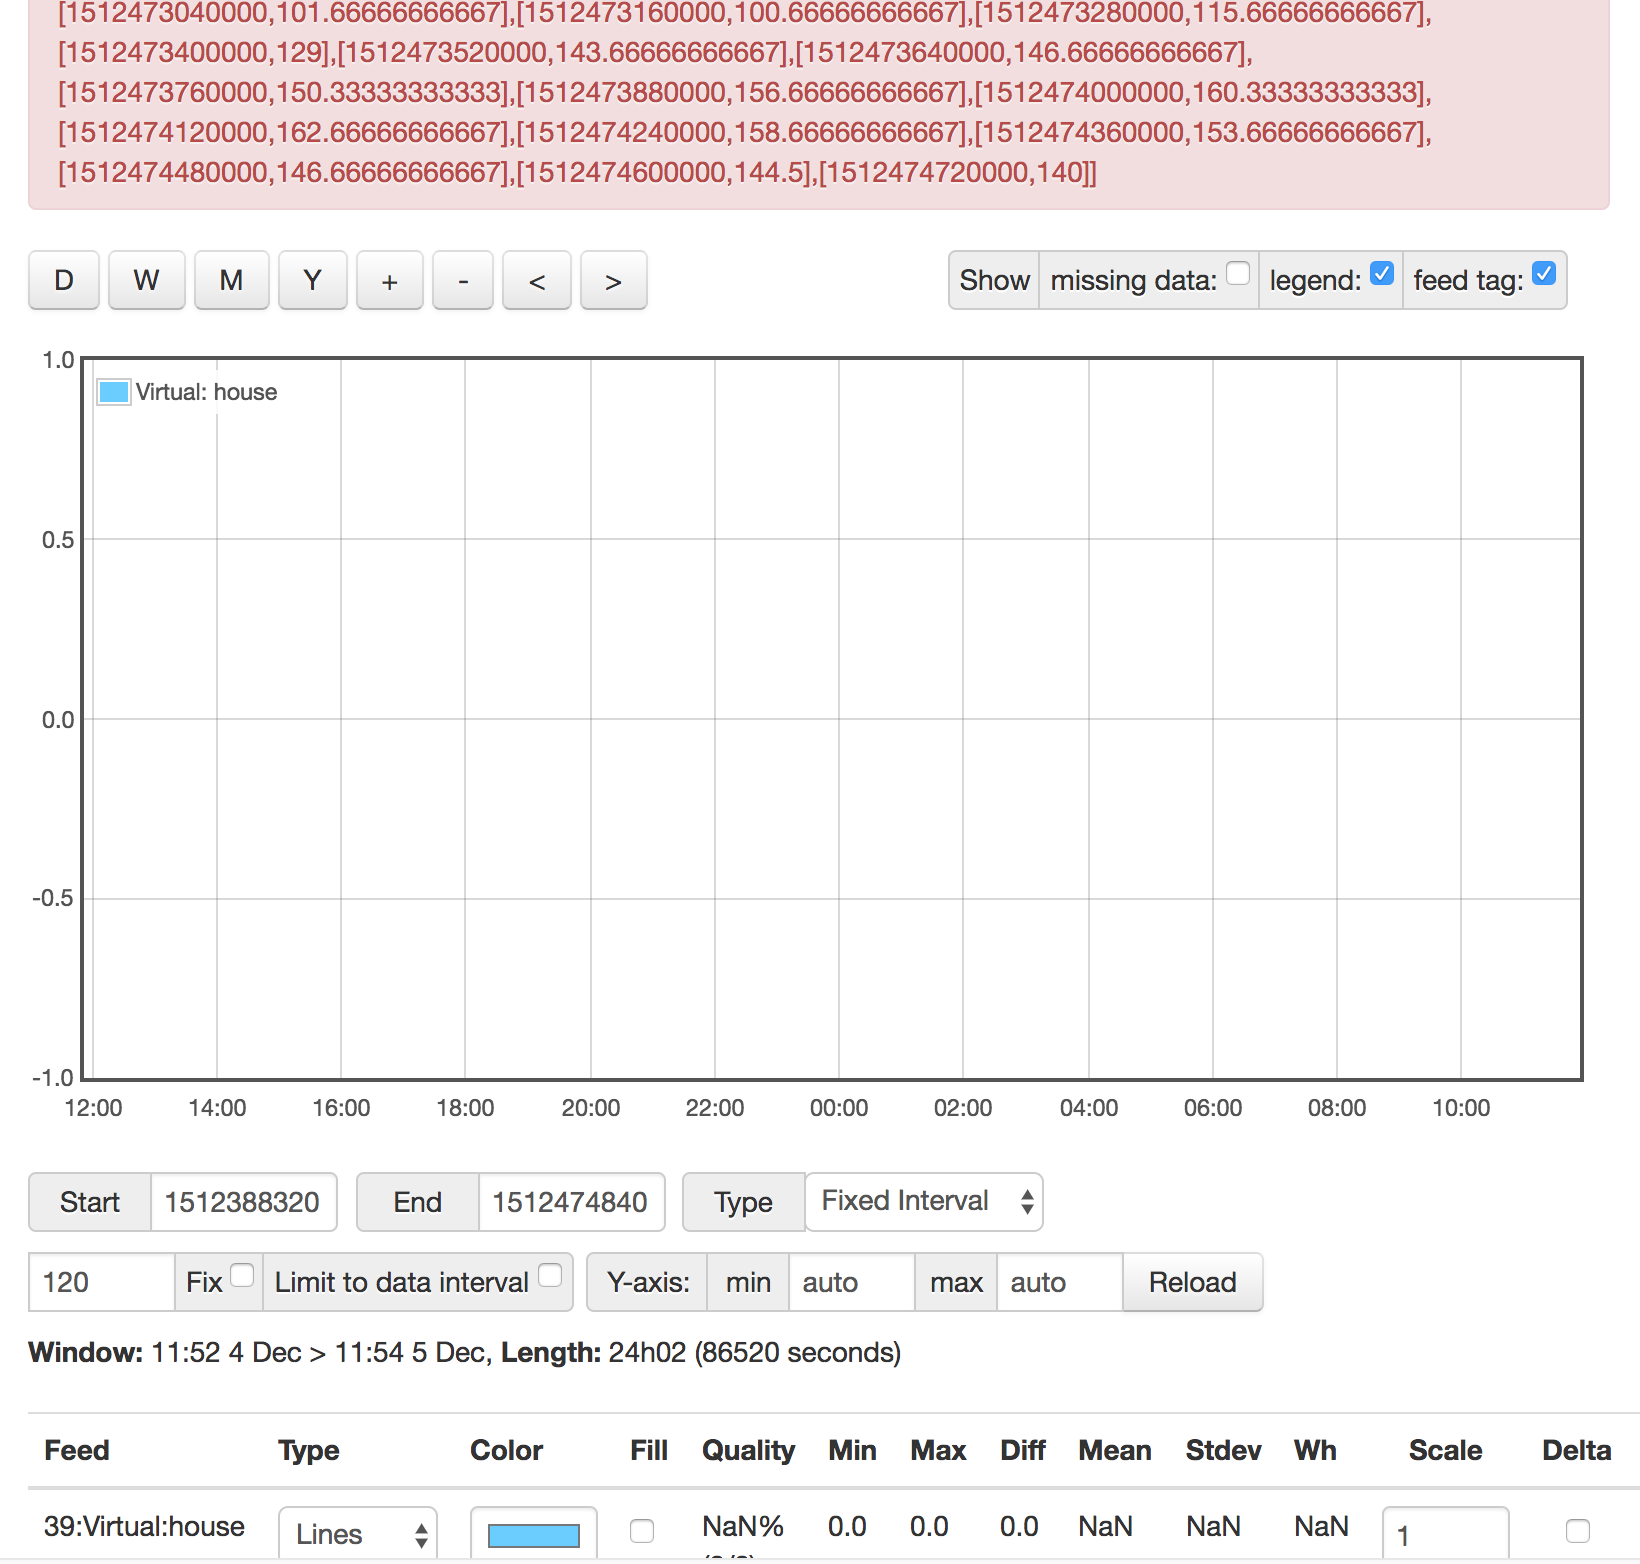
However, when I try to show a graph of that feed, I get tons of errors and no graph:
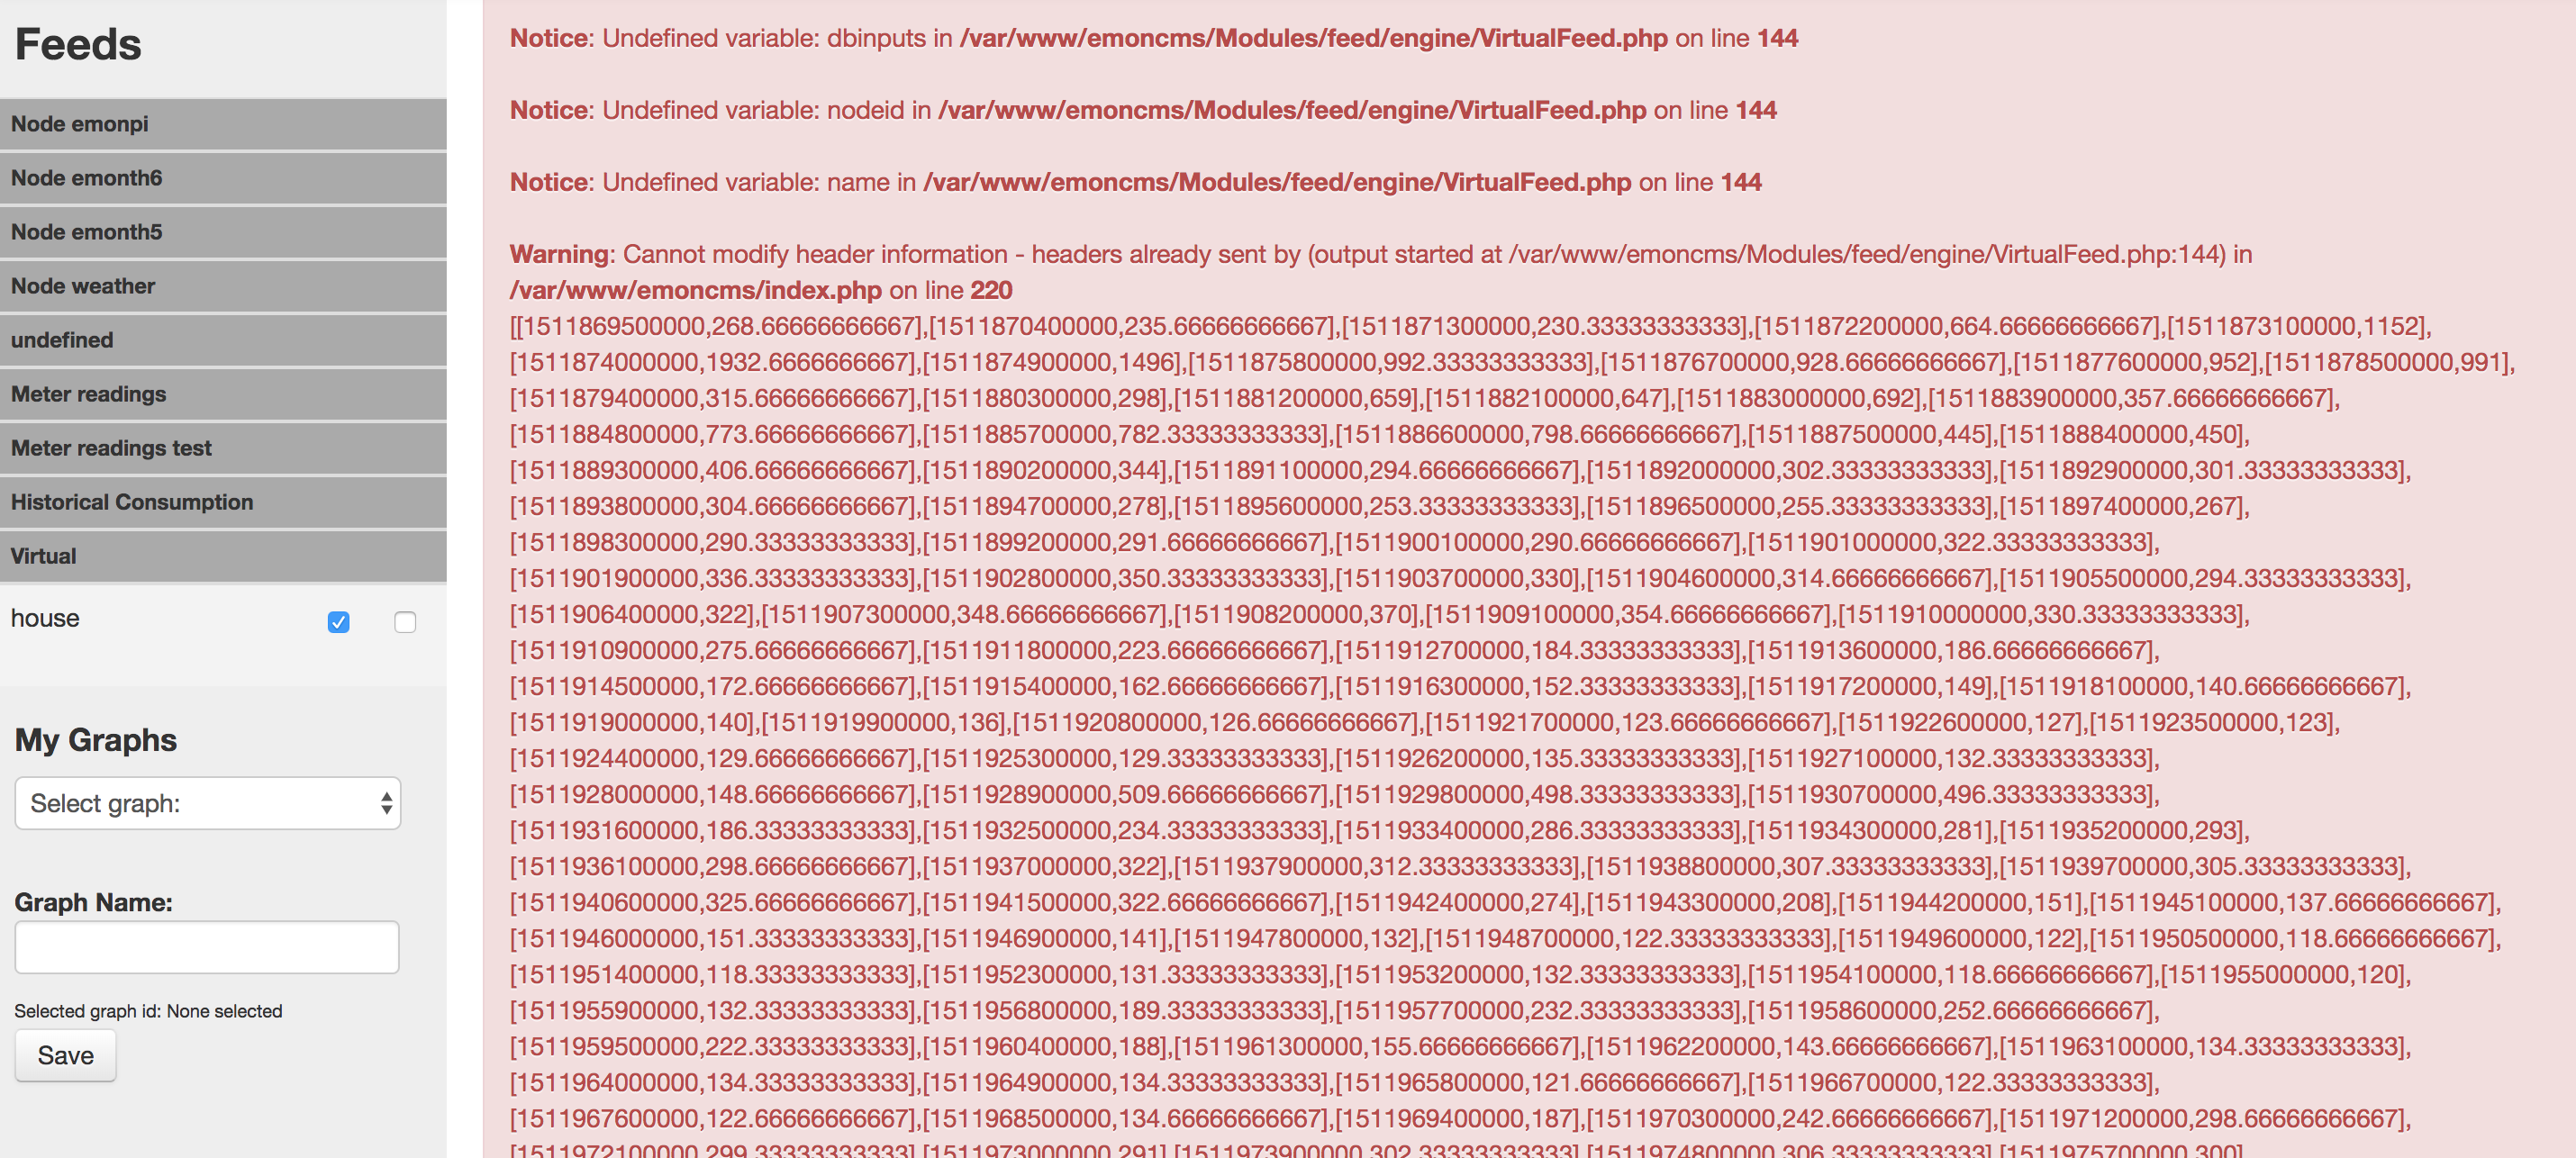
The 3 lines about missing variables occur hundreds of times before the array of value appears in the error message.
What am I doing wrong?