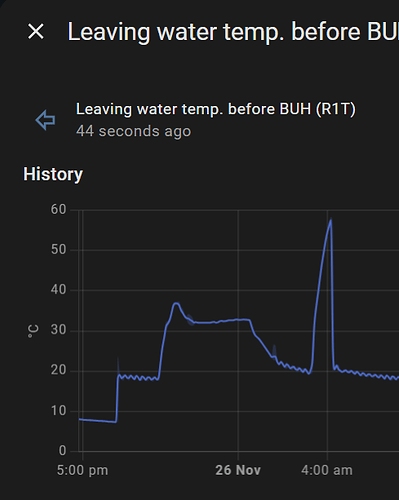
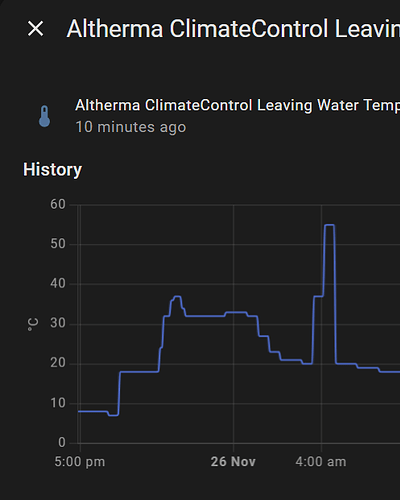
You need a few more data points to make an assessment, I guess the power graph is from Home Assistant, if you do not have an espaltherma setup, try the web API via HACS as a starter -
Then compare the power graph with the corresponding LWT, I noted a few problems when the system was ‘balanced’ too much, so I opened the lockshields completely and allowed more flow, with the espaltherma you can see a lot more data inc l/min, calculate DT/COP etc
espaltherma (near real-time)-
Daikin API - (cloud polling (i think every 10 mins))
check out -

