I wasn’t sure if I I was misunderstanding the dashboard in the Octopus Agile app or if there was an error in the app (or rendering library), but I think I now understand the dashboard.
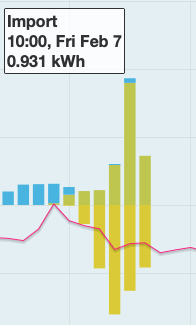
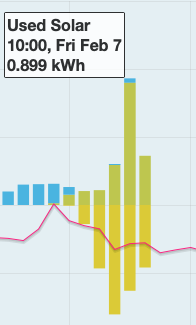
As can be seen in the two screenshots, today, between 10:00-10:30, I used 0.899 kWh of solar generated electricity. During the same period, I supposedly imported 0.931 kWh from the grid. Yet, the blue part of the stacking bar is significantly smaller than the green part.
My new understanding is that the import value is actually the solar generated use + the import. Wouldn’t it make more sense if the import value shown was the actual import? Either that, or change the wording to Usage?
Hello @Rickenbacker sorry for the delay on this. This appears to be a bug, tracked here Mouseover on Octopus Agile incorrect values? · Issue #123 · emoncms/app · GitHub I will get this fixed soon.