I got an emonPi on which I have modified the node firmare to adapt to my monitoring needs. One modification seems to results in interpolation problems in the database. It is visible on graphs and CSV output where some data appear as missing
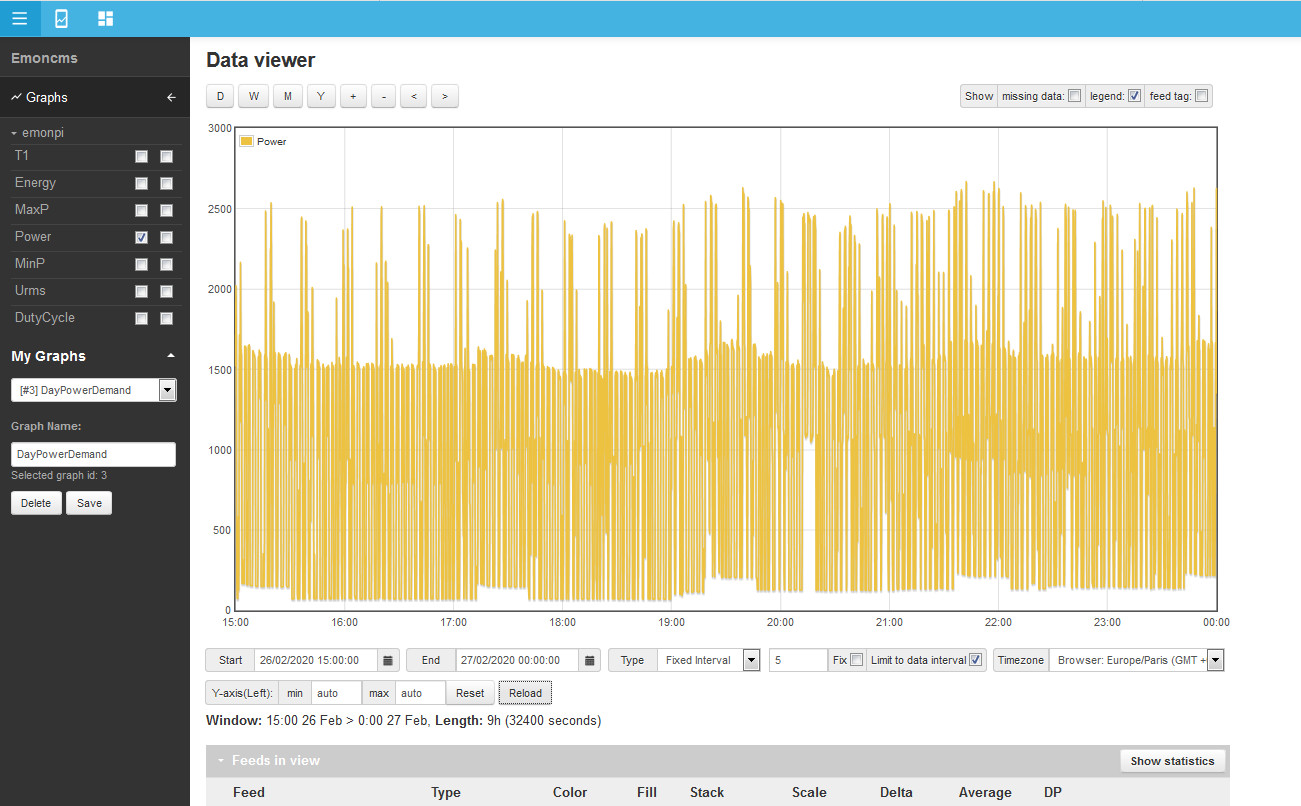
I have changed the timestep for sending electric power via the serial bus from 5s to 10s. I have also changed the calculation method to have an average value over the 10s period. On the emonCMS I have set a feed to log data every 10s via a PHPFINA feed engine.
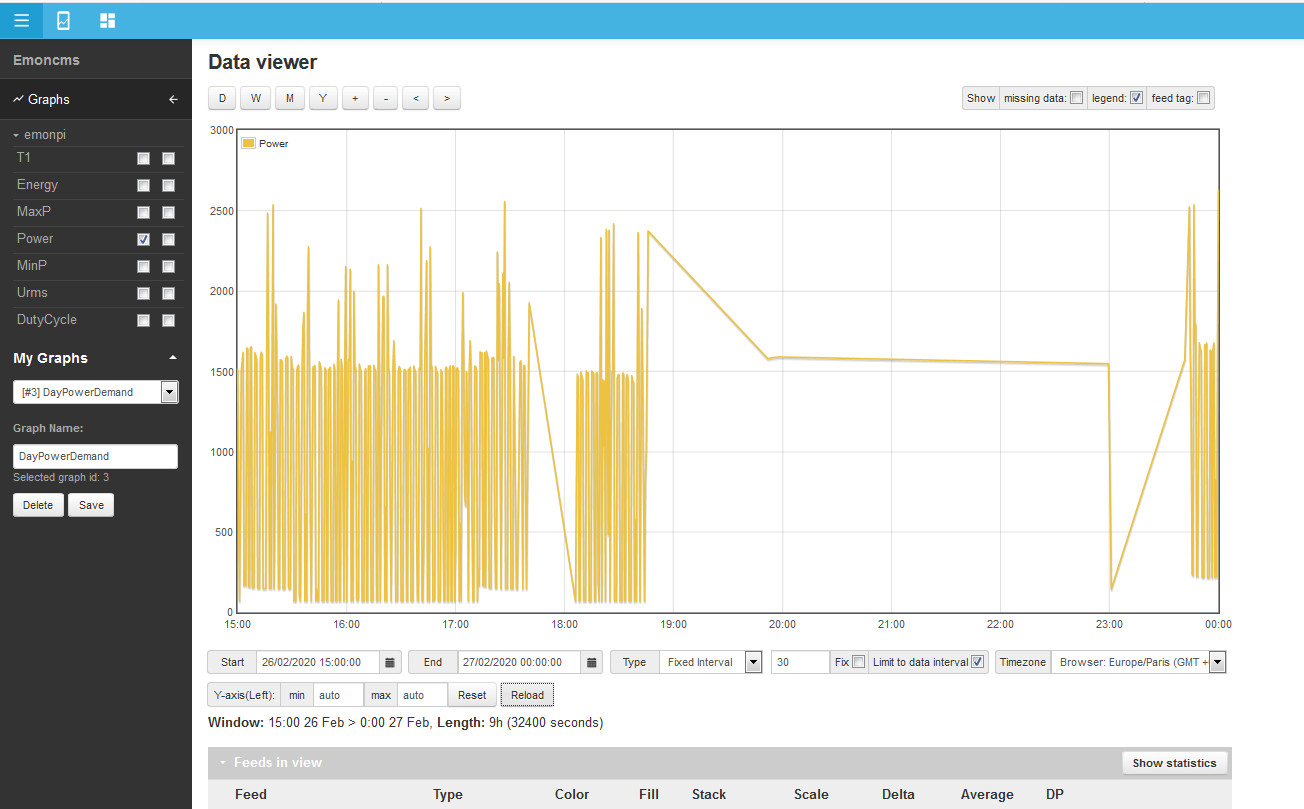
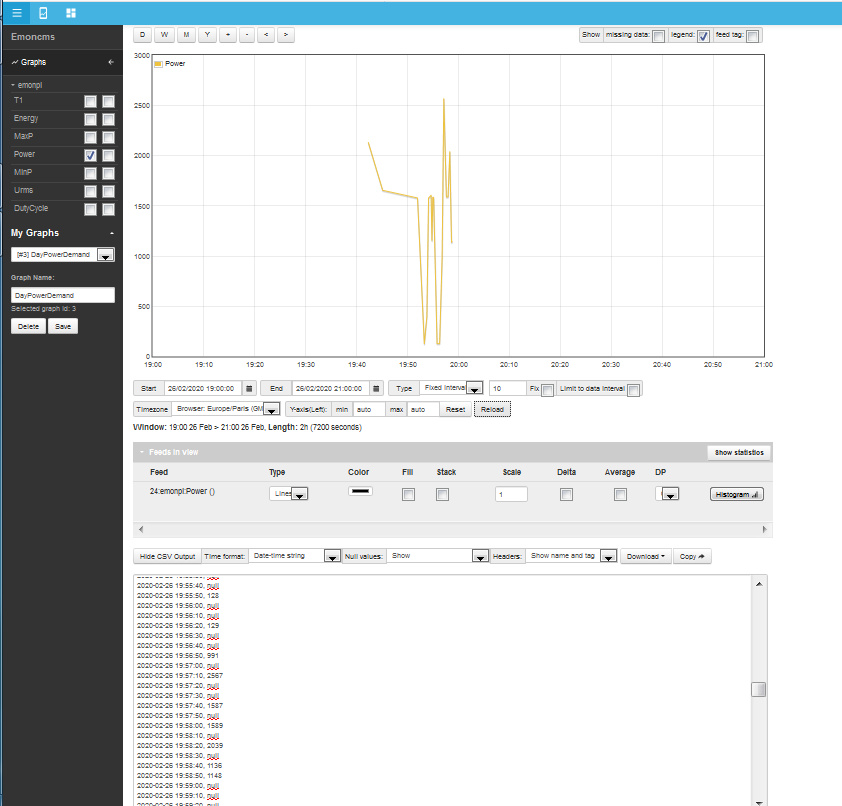
When I display the electric power on a graph, some data could be missing depending on the on resolution I set (i.e. fixed interval). See from 7pm to 11pm on the figure below with a 60s resolution.
It is as if the process look only in a period of 5s every x second, with x the time resolution I set. If a data is available in the period of 5s, then the point is drawn on the graph. But sometimes there is no data available as the node send it every 10s only.
Does anyone have a solution? Do I miss something? I do not want the send data every 5s on the serial port as the node processor is quite busy by other routines.
What you are seeing is a well-known problem. It arises because your data is sent at times according to one clock, and received by emonCMS and allocated to ‘slots’ in the database according to a different clock. If one item is delayed in transmission and arrives late, it misses its slot (you have a NULL value there now) and goes into the next one. If the next item is on time, it overwrites the delayed one.
The “cure” used by the emonTx is to send the data at slightly less than 10 s intervals, say every 9.98 seconds. After a time, a data item arrives a little too early for its slot, and overwrites the previous item. That way, a tiny fraction of the data is lost, but you have no holes in the data.
This is not a cure for the problem, but it is less bad than having NULL values in the database.
There is no interpolation done in the graphing module. It simply picks a value that is closest to the point it wishes to plot. If that happens to be a missing value, you have missing data on the graph.
In fact I notice 2 dinstinct problems: the one you describe Robert and thank you for the tips, and the fact that the feed interval was not 10s like I though, but 5s… A basic mistake on my part but it woud have taken me several days to detect it…
At the top, you will see a checkbox for Show Missing Data. With this checked, instead of bridging gaps, the graph will show gaps where data is missing.