Importing NREL Solar Models in to EmonCMS

The node-red calculation is really cool conceptually, and we’ve been playing with it all afternoon, but we’re not sure how to use this since it’s putting out a single point at a time. We want to be able to look at any day for the next year and see what our irradiation curve is going to be. It is also our goal to eventually be able to derate the ideal production curve based on weather as @peter mentioned.

The spreadsheet we get from PVWatts is pretty much perfect for what we’re doing. Ideally we would populate a single feed in advance with values for an entire year and then use that feed to subtract weather from it.

-Bert

We have data! We got the node-red sun calc working after a little bit of trouble shooting. We don’t know how well it’s tuned in yet, because it’s a cloudy day, so we’re getting some edge-of-cloud effect that is pushing our measurements above what should be the baseline value, followed by the actual clouds (well below baseline). We need a good clear day to tune in the model to match our system exactly. However, in the current implementation, it simply outputs what should be happening now. We still need to be able to write values into the database that represent future timestamps. Is that possible, and if so, how?
-Bert

Here you can see our system balance graph. Battery charge/discharge is in green/red. Yellow is charge controller output. Blue is total load on the system (shown as negative, below zero). Grey is our super awesome PhotoTX laboratory grade irradiance sensor. And then BROWN is the newest, node-red output of predicted solar power. Except it’s not really predicting, it’s realtime.

Another video about edge of cloud effect here.

1 Like

Updated graph with several additional hours. Turned off the yellow charge controller feed in the multigraph to better show the relationship between the NREL model and the measured irradiance. It’s also a good lesson in system sizing and design, as you can clearly see the phenomenon of the edge-of-cloud effect and why it’s important to give a 1.2x safety factor when choosing a charge controller relative to your array size. Make sure it’s capable of at least 1.2x the nameplate specs of the array! (I’ve got an FM80 with plenty of room to grow)

1 Like

Nice to see you are getting somewhere.

My set-up uses a subflow to calculate the three aspects and add them up - the odd thing is I get a negative value at the start of the day and I have not yet had time to work out why.

The cloud cover is from forecast.io which is a “free” feed of data and there is another node-red module to pull in the data on demand when you have set-up your API key on their site. Limited queries per day are free but there are enough for once every 5 minutes. The nice thing for me is that they give multiple granularity forecasts including per-hour for the next 24-28 hours - which includes a 0.0 - 1.0 cloud cover estimate. So I just pull out the number per-sample for current, +3 hours and +6 hours.

Here’s my forecast flow (with subflow) if it’s any help.

forecast.txt (6.5 KB)

(You have to add auth info to the forecast.io function as mentioned)

Here’s a quick graph for a few days ago - the 3 and 6 hours predictions are obviously offset and I can’t see a way in the basic graphing of moving them for visualisation :slight_smile:

1 Like

I think the trick would be to use the bulk upload api and add the forecast period to the timestamp before posting so you are timestamping the “+3hr” and “+6hr” feeds with the prediction 3 or 6 hrs in advance rather than timstamping the prediction for then with the time now.

eg [[unixtime,nodeid,clouds_current][unixtime+10800,nodeid,null,clouds_current][unixtime+21600,null,null,nodeid,clouds_current]]

note the additional “null” strings in the second and third frames, the first frame will post only to the first input of the node, the second frame will not update the first input only the second and the third will update input 3 not the first 2.

This effectively gives one set of 3 values (now,+3hr,+6hr) but each has it’s own timestamp not a common one.

The time the prediction was logged is not useful but is obviously easy to determine from the feed name and the calculated timestamp.

do you have an example spreadsheet?

The bulk upload api is the way to go to upload a large amount of data with predefined timestamps

It should be quite easy to save/export to a csv file from excel in the right format to allow a very simple script to post to emonhub (original) to “pace” the uploads eg 250 frames every 10 secs. Or you write something that does the buffering/throttling/retries and confirmation of delivery etc yourself.

If posting to a phpfina fixed interval feed you will only be able to post upto 48hrs in advance due to restrictions like this line in emoncms, as far as I know the same restriction doesn’t exist in phptimeseries.

If you look at the format of the feed file it may be easier to write a fixed file external to emoncms and transplant it into place if you do not need to be able to update it often. Like a reference feed rather than a recording feed…

1 Like

@pb66, here is the hourly PV performance model for our system by PVWatts:

The idea of writing a fixed external file is a good one, but how do we do that without hosing our entire system? We are not database admins. :confused:

1 Like

The forecast.io data includes per-hour for the next 48 hours but as always with forecasts the accuracy goers down the further in the future you look, so while it should be feasible to pull per-hour cloud cover numbers for the “next day” from the forecast I am not sure how good this will be. On the other hand, it’s not that hard to do - so I’ll look at this and your next suggestion about using the bulk upload tool.

If the data source is the National Weather Service, it’s updated every three hours. As an NWS Electronics Tech from 2007 to 2012, I saw that process first hand.

Forecasting is as much of an art as it is a science. At the forecast office I worked at, they either nailed it, or they were off by quite a bit. Despite the complexity of the task, they managed to get it right more than 80% of the time. Temp, precip, wind speed/direction, sky conditions, etc. were either dead on, or very close to their predicted values.

One of the things that helps them is the fact all of the senior forecasters, and most of the general forecasters have been at that office for 10 years or more. They know the “lay of the land” so to speak, and are very aware of the idiosyncrasies that drive the local weather.

When you say you are not DB admins do you mean you do not have root access (eg emoncms.org) or do you mean you do not have DB admin level skills?

I assumed you were self hosting and had root access, is that right?

Apologies, I haven’t looked at your spreadsheet yet (worked late last night) I have just downloaded it but I’m just heading out again now I will try and take a peek later this evening.

Thanks, you are correct we do have root access. Just not experienced as DB admins.

Another late night I’m afraid, but I have had a look at your spreadsheet and I have a couple of questions.

Is the data a complete data set for 2017? I guessed it maybe as month 2 has 28 days so its Feb but not Feb 2016.

Where do you want the data to start? if downloaded in complete years it may be best to start with 2016 to avoid waiting to compare to real data, in fact if you have real data for the past few months you could have an instant historical real vs predicted comparison to work with. We will need to start at the earliest date as we will not be able to insert earlier data once the feed is initiated.

Is the data raw as it is downloaded? The timestamping is an odd format with month, day and hour in different columns which makes it a bit of a messy formula to achieve a unix timestamp.

Do you want all the fields included? that would require 8 feed files and I think that maybe using the bulk upload would be better than manipulating 8 data files, 8 meta files, the mySQL entries and redis manually.

I have attached your spreadsheet that I converted to an excel file to convert the dates, on the right you will see a unixtimestamp column followed by node id (I chose 4 for now but it can be changed) and the same 8 original fields in the same order. This newly formatted and unlabeled data I put in a plain csv file, also attached.

You can see that file could very easily be parsed and sent to emoncms for normal log to feed processing. emonhub (original) is geared up the task so do you have another pi or pc you could run emonhub on?

Using 8x phptimeseries feeds, which are 9bytes per datapoint, each year would use less than 0.7MB, phpfina would use half the space and is better suited to the task ( faster graphing etc) but has the 48hr restriction. (perhaps we could try relaxing that restriction temporarily?). Using emonhub with a 250frame per 10sec limit it should take less than 6mins to post each years data

pvwatts_hourly.csv (407.3 KB)

pvwatts_hourly.xlsx.txt (1.3 MB) (remove the ".txt"save as a “.xlsx”)

here’s a snippet of the csv file opened with a test editor rather than excel

The first 2 values are Unix Timestamp and NodeId then Beam Irradiance, Diffuse Irradiance, Ambient Temperature, Wind Speed, Plane of Array, Irradiance, Cell Temperature, DC Array Output, AC System Output

1483228800,4,0,0,-0.6,0,0,-0.6,0,0
1483232400,4,0,0,0,0,0,0,0,0
1483236000,4,0,0,0,3.1,0,0,0,0
1483239600,4,0,0,0.6,0,0,0.6,0,0
1483243200,4,0,0,0.6,2.6,0,0.6,0,0
1483246800,4,0,0,0.6,3.6,0,0.6,0,0
1483250400,4,0,0,0.6,3.1,0,0.6,0,0
1483254000,4,2,9,1.1,3.6,9.05,-0.513,19.766,6.606
1483257600,4,3,58,1.7,5.2,59.383,1.412,130.156,114.889
1483261200,4,5,74,2.2,4.1,74.638,2.3,163.083,147.152
1483264800,4,10,110,2.2,5.2,114.427,3.083,249.324,231.578
1483268400,4,10,126,2.2,5.2,131.024,3.467,285.18,266.647
1483272000,4,8,142,2.2,5.7,146.314,3.697,318.229,298.954
1483275600,4,5,116,2.8,7.2,117.366,3.644,255.32,237.444
1483279200,4,3,120,2.8,7.2,121.543,3.68,264.365,246.291
1483282800,4,2,62,2.8,9.8,61.584,2.74,134.387,119.035
1483286400,4,0,21,2.8,8.8,20.275,2.118,44.416,30.802
1483290000,4,0,0,2.8,10.8,0,2.8,0,0
1483293600,4,0,0,3.3,9.8,0,3.3,0,0
1483297200,4,0,0,3.3,9.3,0,3.3,0,0
1483300800,4,0,0,3.9,11.8,0,3.9,0,0
1483304400,4,0,0,3.9,7.7,0,3.9,0,0
1483308000,4,0,0,2.8,8.8,0,2.8,0,0
1483311600,4,0,0,2.2,7.7,0,2.2,0,0
1483315200,4,0,0,2.2,8.2,0,2.2,0,0
1483318800,4,0,0,2.2,7.2,0,2.2,0,0
1483322400,4,0,0,2.2,6.7,0,2.2,0,0
1483326000,4,0,0,2.8,6.7,0,2.8,0,0
1483329600,4,0,0,2.8,6.2,0,2.8,0,0
1483333200,4,0,0,2.8,3.6,0,2.8,0,0
1483336800,4,0,0,2.8,4.1,0,2.8,0,0
1483340400,4,20,10,2.8,4.1,14.154,1.478,28.302,14.986
1483344000,4,36,84,2.8,5.2,105.502,3.417,225.963,208.72
1483347600,4,21,154,3.3,4.6,170.762,5.481,367.506,347.095
1483351200,4,129,174,4.4,4.6,270.647,8.774,572.036,546.523
1483354800,4,419,125,7.2,7.2,439.29,13.29,908.187,872.941
1483358400,4,90,236,7.8,9.3,315.961,11.413,663.184,635.197
1483362000,4,4,172,7.2,6.7,176.246,9.283,374.265,353.695
1483365600,4,11,120,6.7,7.7,125.939,7.685,268.889,250.716
1483369200,4,7,129,6.1,8.2,140.367,7.204,300.285,281.415
1483372800,4,74,33,5,6.2,59.392,4.936,118.739,103.698
1483376400,4,0,0,4.4,6.2,0,4.4,0,0
1483380000,4,0,0,3.9,6.7,0,3.9,0,0
1483383600,4,0,0,3.3,6.2,0,3.3,0,0
1483387200,4,0,0,2.8,6.2,0,2.8,0,0
1483390800,4,0,0,2.2,6.2,0,2.2,0,0
1483394400,4,0,0,1.7,5.7,0,1.7,0,0
1483398000,4,0,0,1.1,6.7,0,1.1,0,0
1483401600,4,0,0,1.1,6.2,0,1.1,0,0
1483405200,4,0,0,0,5.2,0,0,0,0
1483408800,4,0,0,0,5.2,0,0,0,0
1483412400,4,0,0,0,5.7,0,0,0,0
1483416000,4,0,0,0,6.2,0,0,0,0
1483419600,4,0,0,0,5.7,0,0,0,0
1483423200,4,0,0,0,5.2,0,0,0,0
1483426800,4,136,12,0.6,5.2,42.363,0.059,74.537,60.354
1483430400,4,548,41,2.8,5.7,237.058,5.831,452.495,430.039
1483434000,4,480,82,4.4,6.2,341.935,9.355,698.011,669.046
1483437600,4,879,49,5.6,7.2,605.227,14.375,1229.519,1183.405
1483441200,4,793,62,6.7,7.2,623.055,16.038,1268.42,1220.886
1483444800,4,749,95,6.7,7.7,645.111,15.981,1316.424,1267.107
1483448400,4,790,67,7.8,6.2,606.262,17.866,1220.174,1174.397
1483452000,4,841,46,8.3,6.7,527.618,16.53,1049.453,1009.617
1483455600,4,708,35,7.8,6.7,336.515,12.779,646.865,619.33
1483459200,4,382,20,6.7,4.6,118.372,8.248,202.682,185.931
1483462800,4,0,0,5.6,3.1,0,5.6,0,0
1483466400,4,0,0,4.4,2.6,0,4.4,0,0
1483470000,4,0,0,0,2.1,0,0,0,0
1483473600,4,0,0,1.7,3.6,0,1.7,0,0
1483477200,4,0,0,-0.6,2.1,0,-0.6,0,0
1483480800,4,0,0,-1.1,4.6,0,-1.1,0,0
1483484400,4,0,0,-1.1,2.1,0,-1.1,0,0
1483488000,4,0,0,-0.6,4.1,0,-0.6,0,0
1483491600,4,0,0,-1.1,2.6,0,-1.1,0,0
1483495200,4,0,0,0,4.6,0,0,0,0
1483498800,4,0,0,-1.1,2.6,0,-1.1,0,0
1483502400,4,0,0,-2.2,2.1,0,-2.2,0,0
1483506000,4,0,0,-2.8,0,0,-2.8,0,0
1483509600,4,0,0,-2.2,2.6,0,-2.2,0,0
1483513200,4,50,16,-3.3,0,28.014,-4.374,55.915,42.085
1483516800,4,261,62,0,2.6,164.171,2.368,330.885,311.322
1483520400,4,516,97,1.7,4.6,373.799,8.179,767.495,736.526
1483524000,4,663,93,3.3,4.6,528.586,13.355,1082.058,1041.121
1483527600,4,693,123,4.4,3.1,631.175,19.253,1268.588,1221.047
1483531200,4,625,142,5,3.6,613.847,18.939,1237.608,1191.2
1483534800,4,564,122,7.2,4.6,523.116,17.59,1057.169,1017.074
1483538400,4,703,85,6.7,2.6,502.234,19.166,991.46,953.544
1483542000,4,483,63,6.7,2.6,281.079,13.536,547.498,522.63
1483545600,4,185,29,4.4,3.6,83.879,5.29,156.84,141.036

According to Dark Sky they aggregate data from multiple sources depending on the region. I am simply a user so have little idea of the value of the data per se - just it was a convenient “free” source for per-hour cloud cover forecasts for my location (London).

Looks like the lion’s share of the data is from NOAA (NWS) with the balance coming from the UK, Norway and Canada.

A bit further down on that page is the following list:

Data Sources:
1.Dark Sky’s own hyperlocal precipitation forecasting system (id darksky), backed by radar data from the following systems:◦The USA NOAA’s NEXRAD system (USA).
◦The UK Met Office’s NIMROD system (UK, Ireland).
◦(More coming soon.)

2.The USA NOAA’s LAMP system (USA, id lamp).
3.The UK Met Office’s Datapoint API (UK, id datapoint).
4.The Norwegian Meteorological Institute’s meteorological forecast API (global, id metno).
5.The USA NOAA’s Global Forecast System (global, id gfs).
6.The USA NOAA’s Integrated Surface Database (global, id isd).
7.The USA NOAA’s Public Alert system (USA, id nwspa).
8.The UK Met Office’s Severe Weather Warning system (UK, id metwarn).
9.Environment Canada’s Canadian Meteorological Center ensemble model (global, id cmc).
10.The US Navy’s Fleet Numerical Meteorology and Oceanography Ensemble Forecast System (global, id fnmoc).
11.The USA NOAA and Environment Canada’s North American Ensemble Forecast System (global, id naefs).
12.The USA NOAA’s North American Mesoscale Model (North America, id nam).
13.The USA NOAA’s Rapid Refresh Model (North America, id rap).
14.The Norwegian Meteorological Institute’s GRIB file forecast for Central Europe (Europe, id metno_ce).
15.The Norwegian Meteorological Institute’s GRIB file forecast for Northern Europe (Europe, id metno_ne).
16.Worldwide METAR weather reports (global, id metar).
17.The USA NOAA/NCEP’s Short-Range Ensemble Forecast (North America, id sref).
18.The USA NOAA/NCEP’s Real-Time Mesoscale Analysis model (North America, id rtma).
19.The USA NOAA/ESRL’s Meteorological Assimilation Data Ingest System (global, id madis).

So I had a bash at this today and successfully created both phpfina and phptimeseries feeds for each of the 8 variables by using the pre-formatted csv file attached to my last post and a simple bash script.

Firstly though I used the input api to create some inputs so I could then create the process lists including setting up the feeds. For each input I added a log to feed - phptimeseries and also a phpfina with a 1hour interval.

For the phpfina feed to work beyond the 48hr restiction I also edited that “48hr” line in the feed engine code to a more liberal 1000 days temporarily $end = $now+(3600*48*500); and restarted apache2.

Then just ran the attached script firstly on a small subset, then on the remainder. It only took a couple of minutes and it was done, all 8760 frames (70080 datapoints).

Here is a snippet of screen output, it is the final 2 batches so only the first is a full batch of 100 frames. (I’ve edited out my apikey though).


  % Total    % Received % Xferd  Average Speed   Time    Time     Time  Current
                                 Dload  Upload   Total   Spent    Left  Speed
100     2  100     2    0     0      1      0  0:00:02  0:00:01  0:00:01     1
http://localhost/input/bulk.json?data=[[1514296800,4,325,101,13.9,4.6,299.59,19.534,593.214,567.136],[1514300400,4,65,115,12.8,4.1,153.136,15.24,311.321,292.203],[1514304000,4,101,25,11.7,3.6,53.991,11.643,100.379,85.698],[1514307600,4,0,0,8.3,2.6,0,8.3,0,0],[1514311200,4,0,0,7.8,2.1,0,7.8,0,0],[1514314800,4,0,0,9.4,4.1,0,9.4,0,0],[1514318400,4,0,0,10,5.2,0,10,0,0],[1514322000,4,0,0,8.9,5.7,0,8.9,0,0],[1514325600,4,0,0,8.9,4.1,0,8.9,0,0],[1514329200,4,0,0,7.2,6.7,0,7.2,0,0],[1514332800,4,0,0,5.6,5.2,0,5.6,0,0],[1514336400,4,0,0,4.4,5.2,0,4.4,0,0],[1514340000,4,0,0,3.3,5.2,0,3.3,0,0],[1514343600,4,0,0,2.8,6.2,0,2.8,0,0],[1514347200,4,0,0,2.2,5.7,0,2.2,0,0],[1514350800,4,0,0,1.1,5.7,0,1.1,0,0],[1514354400,4,0,0,0,4.6,0,0,0,0],[1514358000,4,177,11,-0.6,3.1,49.81,-1.145,85.709,71.312],[1514361600,4,646,27,1.1,4.6,253.398,4.877,480.251,457.104],[1514365200,4,647,55,1.7,5.7,394.636,7.897,805.708,773.607],[1514368800,4,867,52,2.8,4.6,601.099,14.379,1221.222,1175.408],[1514372400,4,899,58,3.9,4.6,688.042,17.635,1389.698,1337.594],[1514376000,4,918,54,4.4,5.2,705.457,17.613,1426.324,1372.798],[1514379600,4,886,55,5,5.2,642.367,17.037,1295.116,1246.595],[1514383200,4,830,46,5.6,5.2,511.059,15.028,1020.479,981.609],[1514386800,4,673,39,5.6,4.6,319.635,11.619,614.71,588.054],[1514390400,4,172,27,3.9,3.6,76.538,4.71,142.827,127.306],[1514394000,4,0,0,2.2,4.1,0,2.2,0,0],[1514397600,4,0,0,0.6,3.1,0,0.6,0,0],[1514401200,4,0,0,-0.6,3.1,0,-0.6,0,0],[1514404800,4,0,0,-1.7,2.1,0,-1.7,0,0],[1514408400,4,0,0,-2.2,1.5,0,-2.2,0,0],[1514412000,4,0,0,-3.3,0,0,-3.3,0,0],[1514415600,4,0,0,-3.3,0,0,-3.3,0,0],[1514419200,4,0,0,-4.4,0,0,-4.4,0,0],[1514422800,4,0,0,-4.4,2.6,0,-4.4,0,0],[1514426400,4,0,0,-4.4,2.6,0,-4.4,0,0],[1514430000,4,0,0,-5,2.1,0,-5,0,0],[1514433600,4,0,0,-6.1,2.1,0,-6.1,0,0],[1514437200,4,0,0,-5.6,3.6,0,-5.6,0,0],[1514440800,4,0,0,-6.1,3.6,0,-6.1,0,0],[1514444400,4,38,18,-5.6,4.1,26.896,-6.551,55.617,41.793],[1514448000,4,322,65,-3.9,5.2,189.557,-1.665,386.794,365.928],[1514451600,4,584,79,-2.2,6.2,391.708,3.526,818.285,785.806],[1514455200,4,370,160,-1.7,5.7,410.953,4.976,877.297,843.016],[1514458800,4,612,140,-0.6,5.2,590.969,9.976,1238.571,1192.128],[1514462400,4,600,124,-0.6,4.1,572.075,11.577,1191.248,1146.508],[1514466000,4,477,118,0.6,3.6,452.262,10.805,941.593,905.288],[1514469600,4,650,76,1.1,4.1,453.697,10.393,929.055,893.15],[1514473200,4,517,47,1.7,3.6,269.287,7.363,532.252,507.78],[1514476800,4,312,20,0,3.1,99.75,1.32,176.98,160.764],[1514480400,4,0,0,-1.7,3.1,0,-1.7,0,0],[1514484000,4,0,0,-2.2,2.6,0,-2.2,0,0],[1514487600,4,0,0,-3.3,1.5,0,-3.3,0,0],[1514491200,4,0,0,-3.9,2.6,0,-3.9,0,0],[1514494800,4,0,0,-4.4,2.6,0,-4.4,0,0],[1514498400,4,0,0,-4.4,3.1,0,-4.4,0,0],[1514502000,4,0,0,-4.4,3.1,0,-4.4,0,0],[1514505600,4,0,0,-5,4.1,0,-5,0,0],[1514509200,4,0,0,-5,4.1,0,-5,0,0],[1514512800,4,0,0,-5.6,3.1,0,-5.6,0,0],[1514516400,4,0,0,-6.1,2.6,0,-6.1,0,0],[1514520000,4,0,0,-6.7,2.1,0,-6.7,0,0],[1514523600,4,0,0,-7.2,2.6,0,-7.2,0,0],[1514527200,4,0,0,-7.2,2.6,0,-7.2,0,0],[1514530800,4,127,14,-6.7,2.1,43.691,-7.352,81.205,66.895],[1514534400,4,525,35,-4.4,4.1,223.149,-1.064,438.157,416.053],[1514538000,4,784,36,-2.2,4.6,436.405,5.673,895.334,860.491],[1514541600,4,873,51,-1.1,3.1,603.285,12.997,1233.105,1186.861],[1514545200,4,848,49,0.6,2.6,642.787,16.973,1302.103,1253.321],[1514548800,4,932,50,2.2,2.6,711.833,20.34,1421.47,1368.133],[1514552400,4,918,47,2.8,2.6,655.725,19.731,1305.913,1256.99],[1514556000,4,858,40,4.4,1.5,521.794,20.371,1017.04,978.284],[1514559600,4,736,30,3.9,2.6,334.077,12.177,638.945,611.628],[1514563200,4,399,16,2.8,2.1,113.82,5.039,193.093,176.543],[1514566800,4,0,0,-1.1,2.1,0,-1.1,0,0],[1514570400,4,0,0,-1.7,1.5,0,-1.7,0,0],[1514574000,4,0,0,-2.8,0,0,-2.8,0,0],[1514577600,4,0,0,-2.2,0,0,-2.2,0,0],[1514581200,4,0,0,-3.3,0,0,-3.3,0,0],[1514584800,4,0,0,-3.3,0,0,-3.3,0,0],[1514588400,4,0,0,-4.4,0,0,-4.4,0,0],[1514592000,4,0,0,-5,0,0,-5,0,0],[1514595600,4,0,0,-3.9,0,0,-3.9,0,0],[1514599200,4,0,0,-3.9,0,0,-3.9,0,0],[1514602800,4,0,0,-4.4,0,0,-4.4,0,0],[1514606400,4,0,0,-4.4,1.5,0,-4.4,0,0],[1514610000,4,0,0,-5,0,0,-5,0,0],[1514613600,4,0,0,-5.6,0,0,-5.6,0,0],[1514617200,4,32,19,-4.4,0,26.921,-5.719,56.342,42.504],[1514620800,4,26,66,-2.2,0,79.117,-2.747,174.037,157.881],[1514624400,4,12,96,-0.6,1.5,101.34,0.438,222.864,205.687],[1514628000,4,80,147,1.7,1.5,202.557,5.976,433.882,411.883],[1514631600,4,81,202,2.8,2.1,269.467,8.875,571.694,546.189],[1514635200,4,116,256,3.3,2.6,358.076,11.435,751.195,720.703],[1514638800,4,69,158,5,2.6,209.606,9.58,442.836,420.618],[1514642400,4,2,154,5,1.5,158.608,8.419,338.086,318.357],[1514646000,4,25,102,5,1.5,120.149,7.014,255.617,237.734],[1514649600,4,6,26,5,0,27.236,3.704,58.463,44.585],[1514653200,4,0,0,4.4,0,0,4.4,0,0]]&sentat=1471006684&apikey=blahblahblah
ok

  % Total    % Received % Xferd  Average Speed   Time    Time     Time  Current
                                 Dload  Upload   Total   Spent    Left  Speed
100     2  100     2    0     0      5      0 --:--:-- --:--:-- --:--:--     5
http://localhost/input/bulk.json?data=[[1514656800,4,0,0,4.4,0,0,4.4,0,0],[1514660400,4,0,0,3.9,1.5,0,3.9,0,0],[1514664000,4,0,0,3.9,0,0,3.9,0,0],[1514667600,4,0,0,4.4,0,0,4.4,0,0],[1514671200,4,0,0,4.4,0,0,4.4,0,0],[1514674800,4,0,0,3.9,0,0,3.9,0,0],[1514678400,4,0,0,3.3,2.1,0,3.3,0,0],[1514682000,4,0,0,3.3,0,0,3.3,0,0],[1514685600,4,0,0,3.3,0,0,3.3,0,0],[1514689200,4,0,0,3.3,0,0,3.3,0,0],[1514692800,4,0,0,3.3,0,0,3.3,0,0],[1514696400,4,0,0,3.3,1.5,0,3.3,0,0],[1514700000,4,0,0,3.3,2.1,0,3.3,0,0],[1514703600,4,1,6,3.9,2.1,5.968,1.976,12.943,0],[1514707200,4,3,56,4.4,1.5,57.117,3.752,123.938,108.794],[1514710800,4,4,110,5.6,2.1,112.542,6.803,241.412,223.837],[1514714400,4,6,174,5.6,1.5,180.822,9.26,383.932,363.134],[1514718000,4,1,243,6.7,2.1,252.353,12.208,529.144,504.752],[1514721600,4,1,230,7.8,0,237.071,17.525,485.382,462.106],[1514725200,4,1,216,8.3,1.5,223.369,13.784,465.09,442.322],[1514728800,4,40,164,10.6,2.1,197.546,14.762,407.784,386.417],[1514732400,4,69,88,10.6,1.5,120.818,12.844,246.947,229.253],[1514736000,4,3,11,10,0,11.286,8.016,23.711,10.48],[1514739600,4,0,0,8.9,0,0,8.9,0,0],[1514743200,4,0,0,8.3,0,0,8.3,0,0],[1514746800,4,0,0,7.8,0,0,7.8,0,0],[1514750400,4,0,0,6.7,1.5,0,6.7,0,0],[1514754000,4,0,0,6.7,0,0,6.7,0,0],[1514757600,4,0,0,11.1,4.1,0,11.1,0,0],[1514761200,4,0,0,11.1,3.1,0,11.1,0,0]]&sentat=1471006690&apikey=blahblahblah
ok

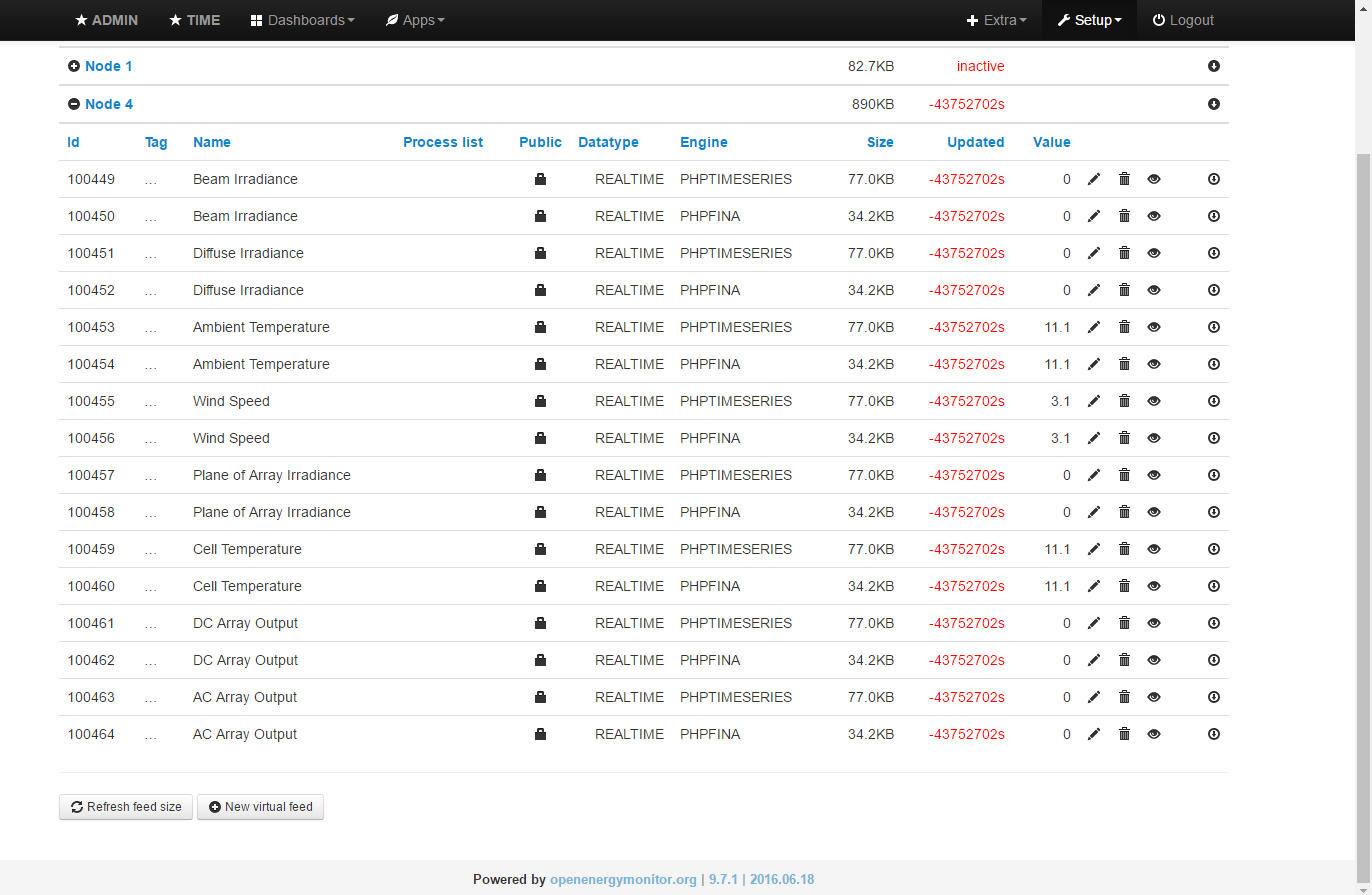
Here is a screenshot of the feeds page showing the data sizes which appear correct (8760x9bytes=78840 /1024=76.99kB & 8760x4bytes=35040 /1024=32.21kB)

If you have a file for 2016 start with using the formula in the speadsheet I posted to get a pure csv file (watch out for windows/unix line-endings), or give me the file and I will convert it for you.

I’ve attached the script which you will need to edit for your own apikey etc but running the script is the final step, the feeds and the csv all need to be setup first. There is little or no error checking (and I should add some comments too) so you must fully prepare before running it.

upload_csv.sh.txt (969 Bytes)

fancy giving it a go?

2 Likes

Haven’t had the chance to try this out yet and it’s our summer intern Berkeley’s last week so I don’t know if we’ll get around to it before he goes. However, we got some awesome data yesterday with the existing implementation correlating with cloud cover. As you can see in the graph below, when the cloud forecast surpasses 0.6 the irradiance becomes spotty and when cloud cover approaches 0.9 it drops to less than 30% nominal output. Pretty cool!

Cloud cover is graphed in blue and scaled 0 to 1 on the left hand side. All other units are in Watts 0 to 2000

1 Like

I realise this thread is 3 year old, but this looks really interesting! I need to figure out a solar forecast for the DemandShaper module Emoncms Demand Shaper module - #24 by Rjallan21 are any of you still using the procedure described above? was there any more development on this? Ideally Id like to implement this as a script that produces the forecast for a given location, did anyone take that approach rather than using node red?

1 Like

Haven’t made any changes or progress on this since we implemented it. Curious to see if anyone else has advanced it further.

1 Like

thanks @SolarMill

There is a very useful solar forecasting tool that has been developed out of research at the Australian National University, and commercialised by Solcast. It can provide a solar forecast for any location.

They say “Solcast can forecast solar data for any location on Earth. Using five weather satellites and a growing suite of numerical weather models, Solcast generates over 600 million actual and forecast data points every hour.”

“For the majority of locations, Solcast Live and Forecast data is updated every 10 to 15 minutes at a resolution of 1 to 2 km.”

While primarily for large & commercial PV installation, home rooftop systems can access some services for free.

There is a “tuning” system available where machine learning is used on historical data, so forecasts can be more accurate. I was looking to use the forecast/tuning
facility but my system is setup with variable (manual) export limiting so not suitable for this.

2 Likes