How to create a feed with kWh/hr?

Hi, in Norway a new electricity usage policy is going to be implemented next year. If I use more than a certain amount of kWh within 1 hour, I get a penalty for the entire month. There will likely be two steps, 5kWh and an even higher penalty if I use >10kWh. One quite efficient way for me to keep below 5kWh is to turn off power to the water heater (2kW) for a period. I use Home Assistant for this. Currently HA turns off the heater after 15 min of >5kW usage. A better rule would be to accumulate Wh every hour and turn the heater off when exceeding a maximum value (4, maybe 4.5 kWh?).

Can anyone help me adding calculations to achieve this?
Is that per clock hour, or per ‘any 60 minutes’?

Pr clock hour would be best, as this is the time interval we would be charged.

I think any 60min interval would be difficult to control.

Hmm, still not easy.
Maybe something with 24 schedules? One for every hour of the day…

Or with Node-red, like Calculate quarter-hour peak in kW - #38 by m2ts

I was hoping that, there being a built in function for kWh/day, a kWh/some-other-interval was obtainable…

i’d be tempted to extract the relevant data into a database and do the calculations there - probably because thats what I am most familiar with! I haven’t looked at the emoncms api recently, there may be a way of extracting what you seek directly from that, I will have a look unless someone beats me to that answer!

Just as a matter of interest re the policy - what does that do for EV charging/heat pump use at home? What caused it to be introduced?

Thanks for looking into this, appreciate it! FWIW, my emoncms is running on a two year old EmonPI, and I do most of the pixel peeking into the data there. However, to get a good integration of a variaty of sources, I use Home Assistant on a RPI4. The time resolution is not as good, but I think I can get 1 min data at least. My knowledge of databases are a bit limited, but if it helps, I can look into setting up an influxdb on the HA RPI. Grafana is also quite readily available. I have never sat down and gor it to work, though. But maybe those tools can be a good way forward?

About the pricing policy - I can try and describe it in a simplistic and probably not entirely accurate way. draw breath:
“Over-usage” was a term in the 70’s and even 80’s.Everyone had an analog watt-o-meter on their kitchen wall, easy to see. Watts over a certain amount were more costly. I have no idea how they did the calculations. The reason I guess was to not overburden the grids, but also because older houses built pre 80 only had 10A or 20A mains. I would also think (personal hypothesis) there was a social democratic thought to be sober in all aspects of life, not use more than necessary etc. Anyway, now everyone have automatic meter readings with wireless transfer to the grid owner, at least hour data. The el cost is divided in two parts, cost pr kWh (billed by the producer in the free el market) and power grid rent pr kWh (billed by the local power grid owner, which of course has a monopoly). The power grid in Norway is reasonably well dimensioned within each region. Between the regions, however, there is a severe under-capacity. Southern regions are hardwired to the European grid with market controlled export/import, which sometimes causes local undercapacity and high prices. Northern regions are sort of protected from the EU market due to the poor transfrer lines, but are then more sensitive to amount of rain (Norway is almost entirely hydropowered). Due to available hydro power, there’s been a lot of power hungry industry (e.g. aluminium) distributed along the very long coastal line for the past 100-150 years. The industry has for years been contracted such that power grid owners can give a penalty for over-loading their grid. Which makes sense thinking of the finite grid capacity. In my previous job we could not start the 2 MW gas compressor in January since that would cause a power surge in the community in a several km radius, and my company would see very high power prices the rest of that year.

Grid owners have for years tried to implement this penalty model on private homes as a means to smoothen peaks and balance the usage more evenly during the 24h day (why isn’t there the word “døgn” in English??? Døgn=24hrs from 00 to 24, very useful term). With the new, automatic meters, this is now technically possible. And the step wise model will be implemented from 2022. It is estimated that 54% of homes will be able to always stay below 5kWh pr hour, but our house is not there without taking any mitigating actions.

Aren’t you guys leading the world in EV take-up too? They may be trying to encourage everyone to wind down their EVSEs. Left unrestrained, they often draw 7, 11 or even 22 kW for hours on end.

Sorry, see now that I did not answer your question at all.
Yes, I think the tax policy has made Norway World leading in EVs, with almost no tax and until now 100% discount on toll roads. And home charging is a challenge for people with street parking, but not really a problem if you live in an apartment house with private parking or have your own house with quick charger. I have two diesels (19 Yr old land cruiser and a Subaru, we like/need the 4x4 and offroad capabilities), so I do not really have first hand experience. I know some with old houses must upgrade the mains, and most can upgrade to 400V three-phase intake, with 60A mains and a 16A or more EV charger.

The new grid policy will be efficient to encourage EV charging during night, and there are el companies now that have smart and automatic charging based on low price times (during night and mid day mainly).

So the 5 / 10 kWh / hr penalties will only apply during the day, or during peak times?

For kWh per hour the current solution in emoncms is to record a cumulative kWh feed and then extract hourly values using the delta mode, there’s a guide on how to do this here: Calculating Daily kWh - Guide | OpenEnergyMonitor - it’s nice in that it gives you the option of changing the interval that you are interested in e.g kWh/hour kWh/day when you request the data.

As far as I can see from the suggested policy, penalty will hit as an extra grid fee the current month if you exceed 5/10kWh any hour of the day.

Are you now referring to a method to create a separate feed, or the graph functionality in Emoncms? I’ll read the guide more closely and see if I understand.

yes the graph functionality in emoncms

Unfortunately that does not help me, as the pr hour feed will need to be available in HA to be able to turn on/off of the water heater power. I guess the next step will be to look more closely into a separate method outside emoncms to create that feed.

Hello @OlavKristiansen In the latest emoncms master there is a change to the API that might help you, it can return e.g hourly consumption calculated from a cumulative kWh feed, it moves the delta calculation to the server side:

/feed/data.json?ids=FEEDID&start=UNIX_TS_MS&end=UNIX_TS_MS&interval=3600&delta=1

Example of the data returned:


[
  {
    "feedid": "165092",
    "data": [
      [
        1638259200000,
        4.353515625
      ],
      [
        1638262800000,
        1.97265625
      ],
      [
        1638266400000,
        0.439453125
      ],
      [
        1638270000000,
        0.5537109375
      ],
      [
        1638273600000,
        0.9462890625
      ],
      [
        1638277200000,
        0.57421875
      ],
      [
        1638280800000,
        0.5537109375
      ],
      [
        1638284400000,
        0.552734375
      ],
      [
        1638288000000,
        0.9951171875
      ],
      [
        1638291600000,
        0.994140625
      ],
      [
        1638295200000,
        0.48046875
      ],
      [
        1638298800000,
        0.7744140625
      ],
      [
        1638302400000,
        0.7275390625
      ],
      [
        1638306000000,
        0.7314453125
      ],
      [
        1638309600000,
        0.6220703125
      ],
      [
        1638313200000,
        0.0888671875
      ],
      [
        1638316800000,
        0.0869140625
      ],
      [
        1638320400000,
        0.05078125
      ],
      [
        1638324000000,
        4.888671875
      ],
      [
        1638327600000,
        4.412109375
      ],
      [
        1638331200000,
        1.9013671875
      ],
      [
        1638334800000,
        0.5185546875
      ],
      [
        1638338400000,
        0.140625
      ],
      [
        1638342000000,
        0.4462890625
      ],
      [
        1638345600000,
        0.14694020800016006
      ],
      [
        1638349200000,
        null
      ]
    ]
  }
]

Now, that looks promising! I do not understand where this code should be implemented, though. I have only used the emonpi GUI, and not accessed any config files. Where should a code like this be implented? Will it create a separate feed?

No config files needed, it’s just the latest version of emoncms that you need, you can switch to this if you go to Admin > Components and click on the Master button, that will switch all the different emoncms components over to master from stable.

Then from HA, you would need to somehow request data from this API, Im not quite sure how you would do that but there may be others here with more experience of HA who can help.

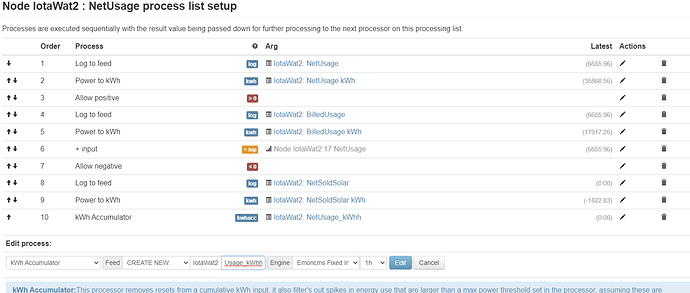
Ok, so I did this, added a new feed NetUsage_kWhh:

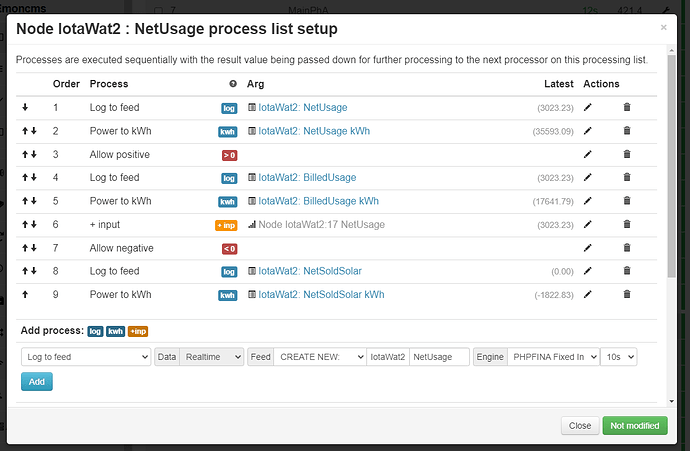
I find it a bit hard to understand inputs and outputs for the different calculation steps, but does it look correct?

I also wonder if this feed will accumulated every 10s time step (the general sample rate in my setup), or if it will have a new value after every one hour has passed. If the latter, it cannot be used for control purposes. What I am after is a saw tooth Wh (or kWh), which accumulates every time step for a period of one hour and then resets to 0 after every 3600s. Preferably every whole hour.