I’ve just started using Grafana and importing the data from EmonCMS into it via MQTT. Doing this with power1 and power2 means I can display current consumption and generation with ease.
I’m trying to work out how to display totals for consumption and solar generation in Grafana and I figured I should ask how EmonCMS works these totals out.
My interval for reading power1/power 2 is 10 seconds. I’m therefore assuming that EmonCMS takes a sum of each 10 second reading and then divides it by 6 to get an average consumption for the minute? It’s then just an extrapolation for how long the period is of data showing?
Or is there some other way it is done and if so, is it its own feed to so speak which I could publish via MQTT?
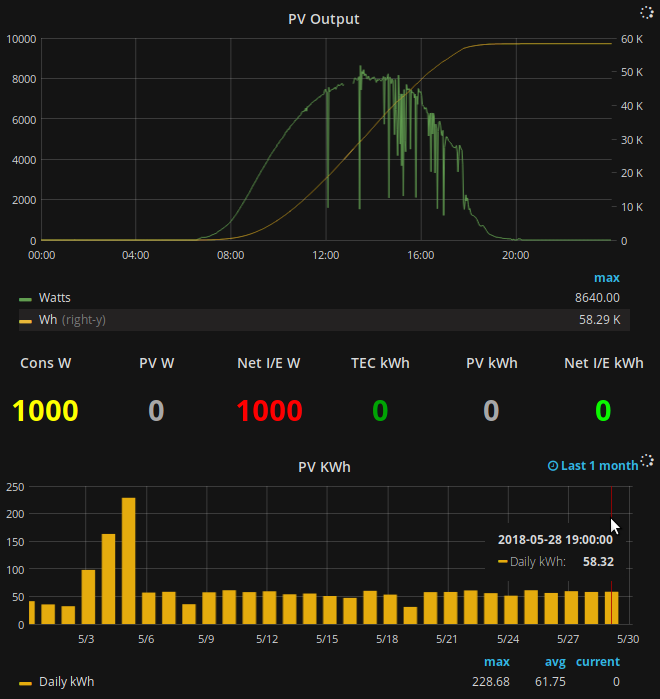
Note that Wh in the upper graph reads 58.29 K and the Daily kWh figure in the lower graph (above the bars, near the arrow) reads 58.32, so not spot on, but quite close.
Could I ask a favour, could you paste your code for your graph here, I’m having issues getting mine working right so I’d like to have a look at what you did. Thanks.
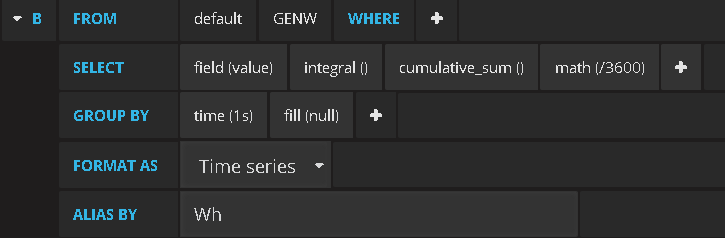
Here’s the text as shown in my query editor after toggling edit mode: SELECT cumulative_sum(integral("value")) /3600 FROM "GENW" WHERE $timeFilter GROUP BY time(1s) fill(null)
Replace “GENW” with the name of your measurement. Include the quotes.


 ← A gift from me.