I thought you might like to see the results of my efforts so far on displaying information regarding the temperature of the rooms in the house and hot water; The effects of solar generation and and the charging status of the i3 electric car (REX).
I have a website and have embedded graphs; apps and dashboards using tables and iframes and the embedd=1 attribute to show just the bare graphs/apps/dashboards.
I have to say straight away that I have plagiarised the Octopus Agile app so I hope the author will not be too cross with me. As others will know I have successfully loaded the Agile data into my local emoncms but I can’t find away of showing it in the future unlike this app. The author is clearly much more adept with PHP/HTML/javascript than I ever will be so I created my own app, copied his php and commented out his display code so I just got what I required. I comfort myself by feeling that I have put out golang code into github for others to use for some marine instrumentation which utilise the raspberry pi.
Here is the screen:
It sits in the kitchen and runs off a samsung tab 8 which has the usual usb fault and so needs to stay on power all the time to keep the battery charged. I am using the fully kiosk browser app ( free version) to continually display and still provide updates and the components are from emoncms. Although the Octopus app does not update in this mode so I have it refreshed every 10 minutes.
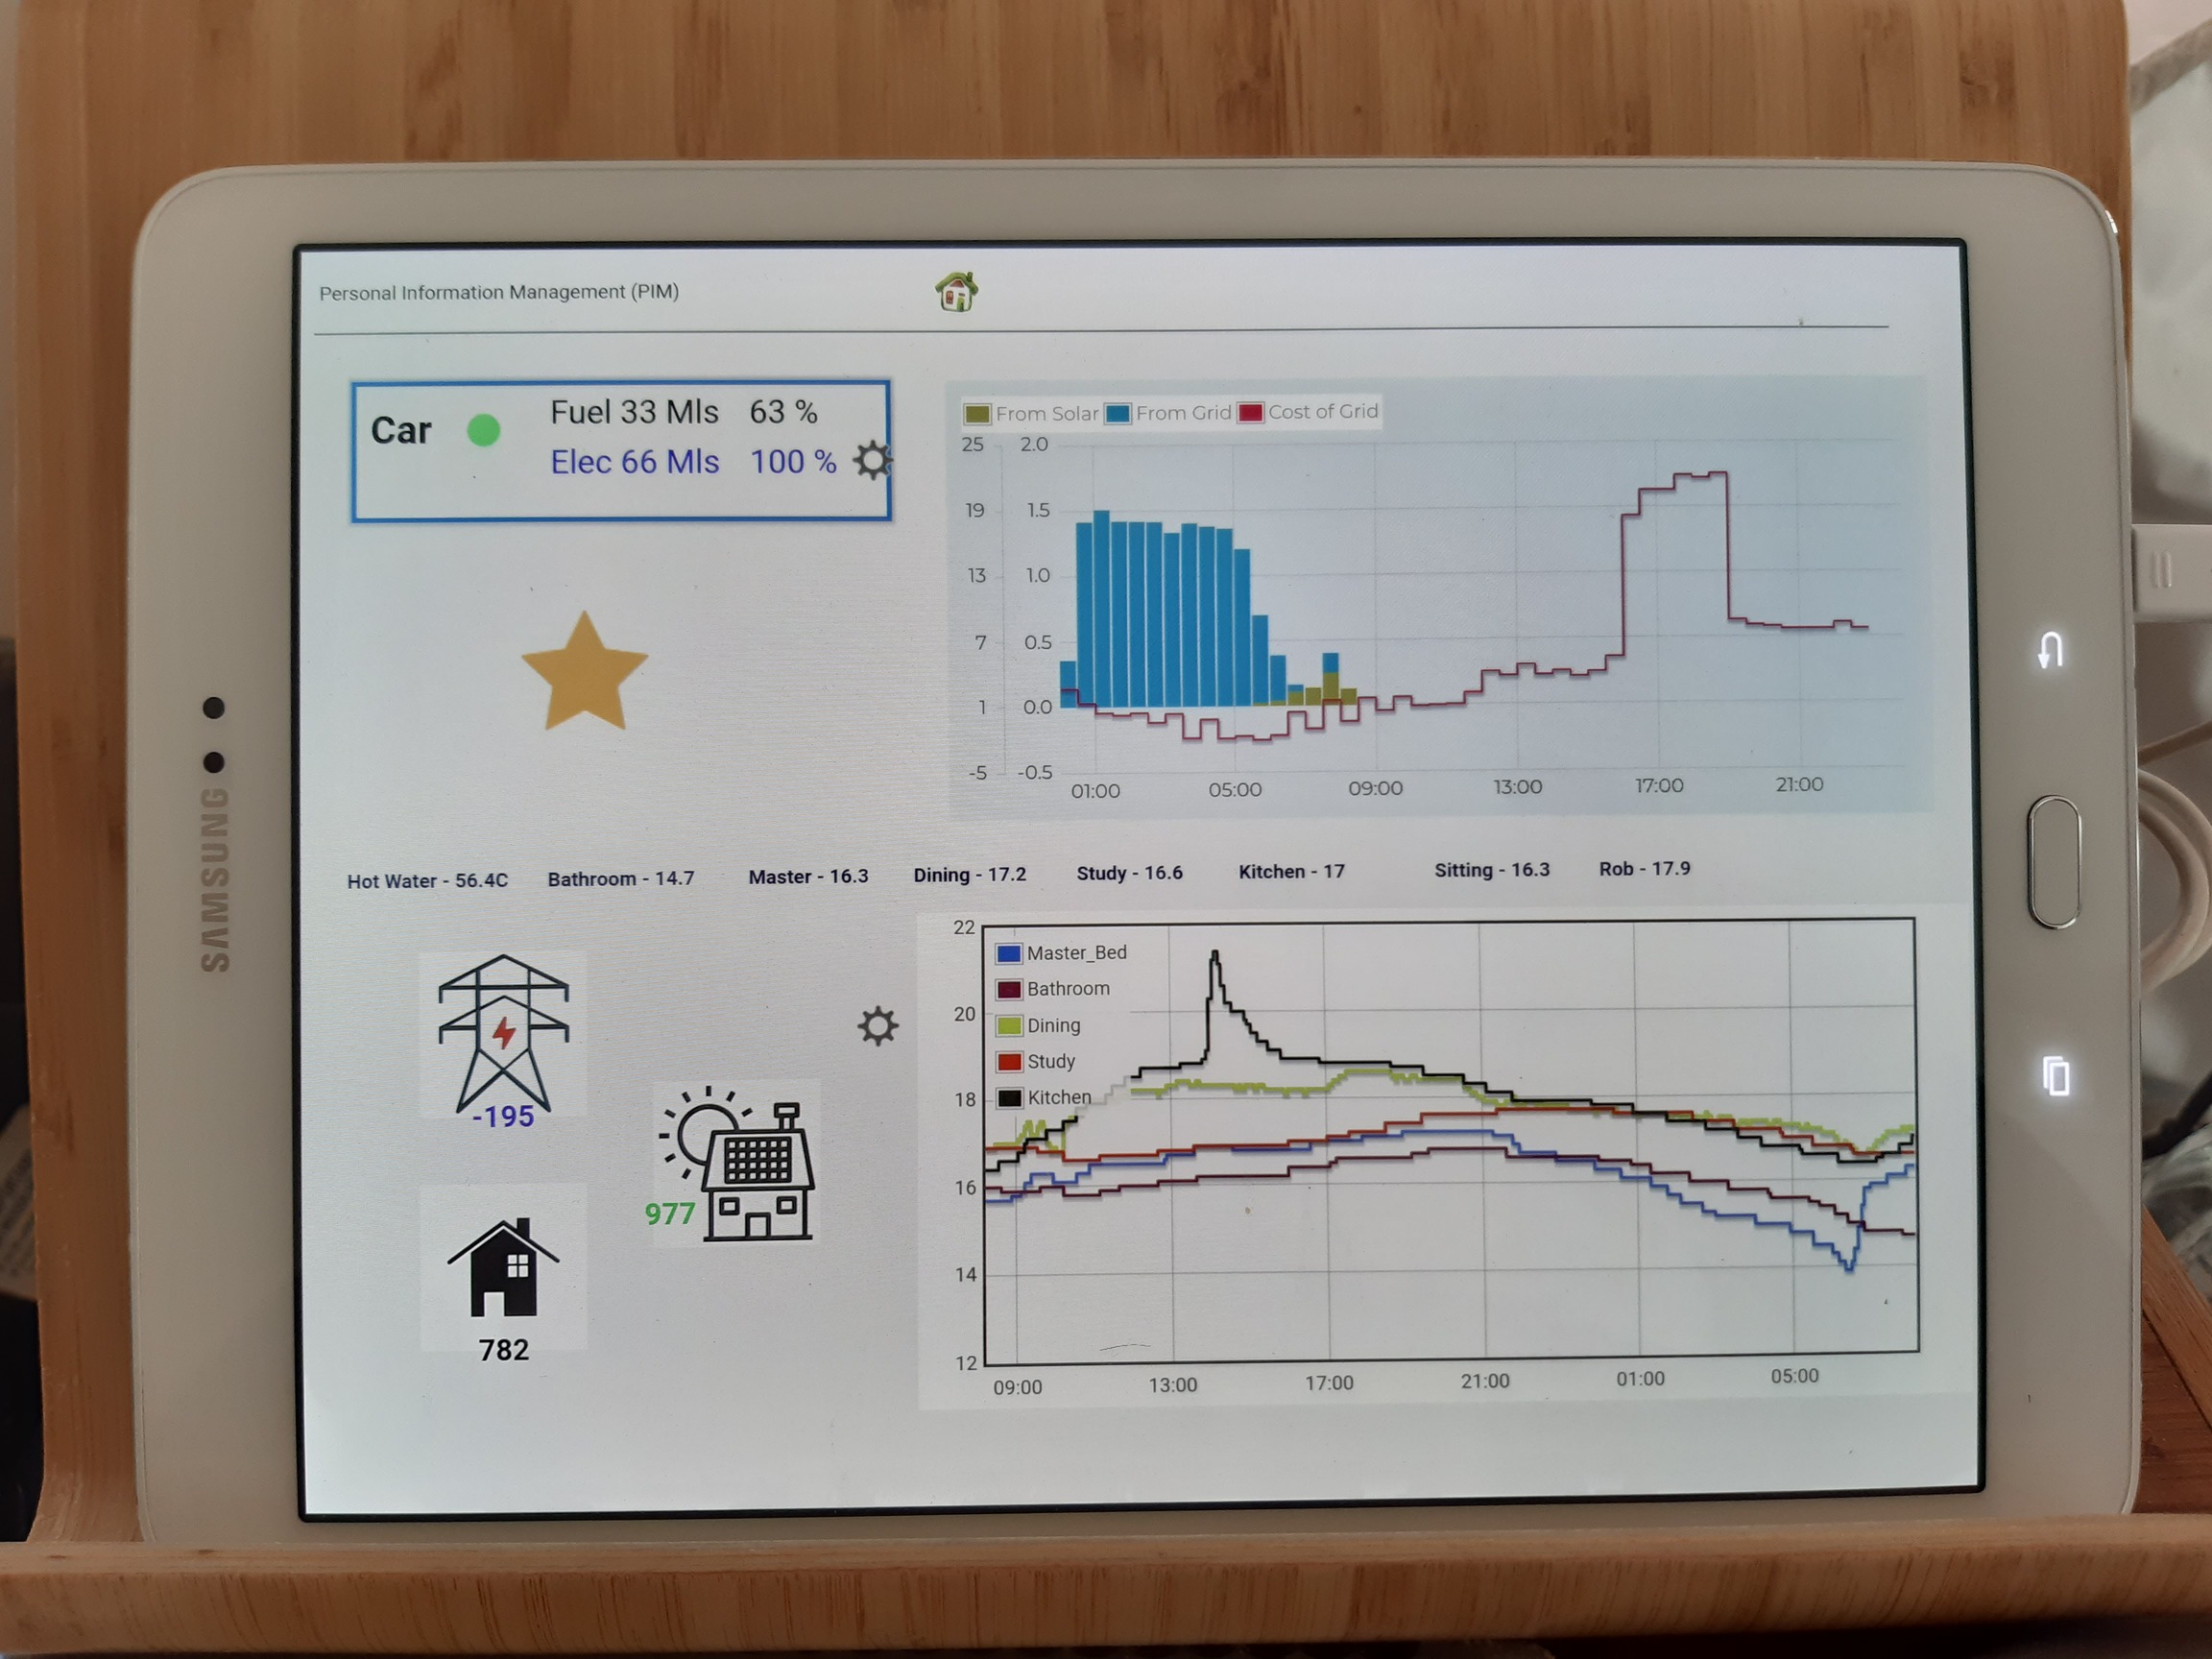
Top left shows the car status and a star which states whether we can put on white goods. Amber means one white good and green means 2. ( I would like it to go green when we have a plunge alert but still working on the feed logic). The car is green - because it is fully charged. It would be red if it is not charged and it is not being charged.
The top right is the Octopus Agile app where I have kept the graph bit only and removed the outgoing tariff part.
The middle is a display of all the important temperature zones in the house. Evohome provides the output and if you want a fully controlled zonal heating system I would recommend this. Has worked well for me for over 5 years now and saved around 30-40% fuel bills per annum.
The bottom left shows what electricity we use in the house; what the solar panels are providing and what we are drawing from the grid. The pictures shows that this morning we are only using solar energy.
The bottom right shows a 24 hour history of the temperatures in the house. Currently the heating is off so this is more interesting in winter where we heat rooms to different temperatures at different times of the day.
My wife tells me the display is interesting but the only ones she really needs is the status of the car and the star showing if she can put the washing on 
You note the plunge alert overnight from Octopus which meant we were paid last night to charge the car up.
I hope this is of interest to you all. If anyone knows how to remove the gears in the top left and bottom left ( dashboard) please let me know.