I created a dashboard for use on my phone - a scrolling visualisation of all my feeds in emoncms.org.
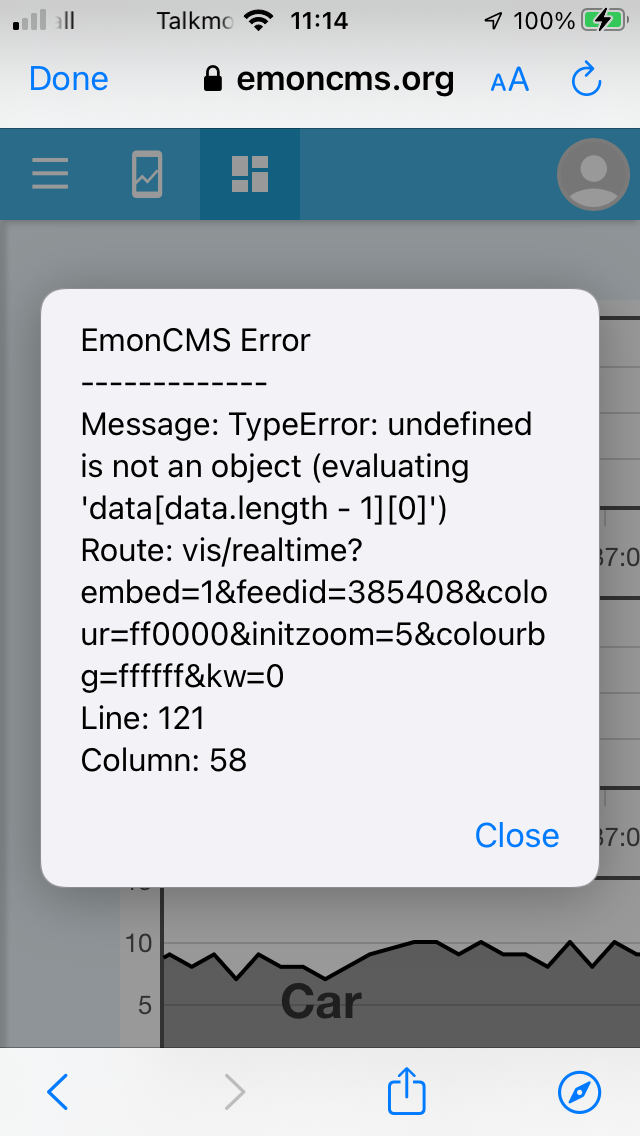
A while back, only one of the 6 graphs is displaying correctly (Labelled Car in the screenshot). The other 5 cause pop-ups like that shown every 10 seconds or so.
It looks like all my feeds are getting valid data when I look at them on the Feeds page. Its just the dashboard that is erroring.
Hi Brian, Thanks for your reply. Yes I have tried clearing the browser cache and I have tried in several browsers and devices, all with the same result.
I have dashboards with “static” graphs of the same feeds and these are working OK. The object I am having trouble with is the realtime, scrolling graph of a feed. The error message in the scrrengrab below looks like it is an error at the emoncms.org server, rather than at my browser. Is that right?
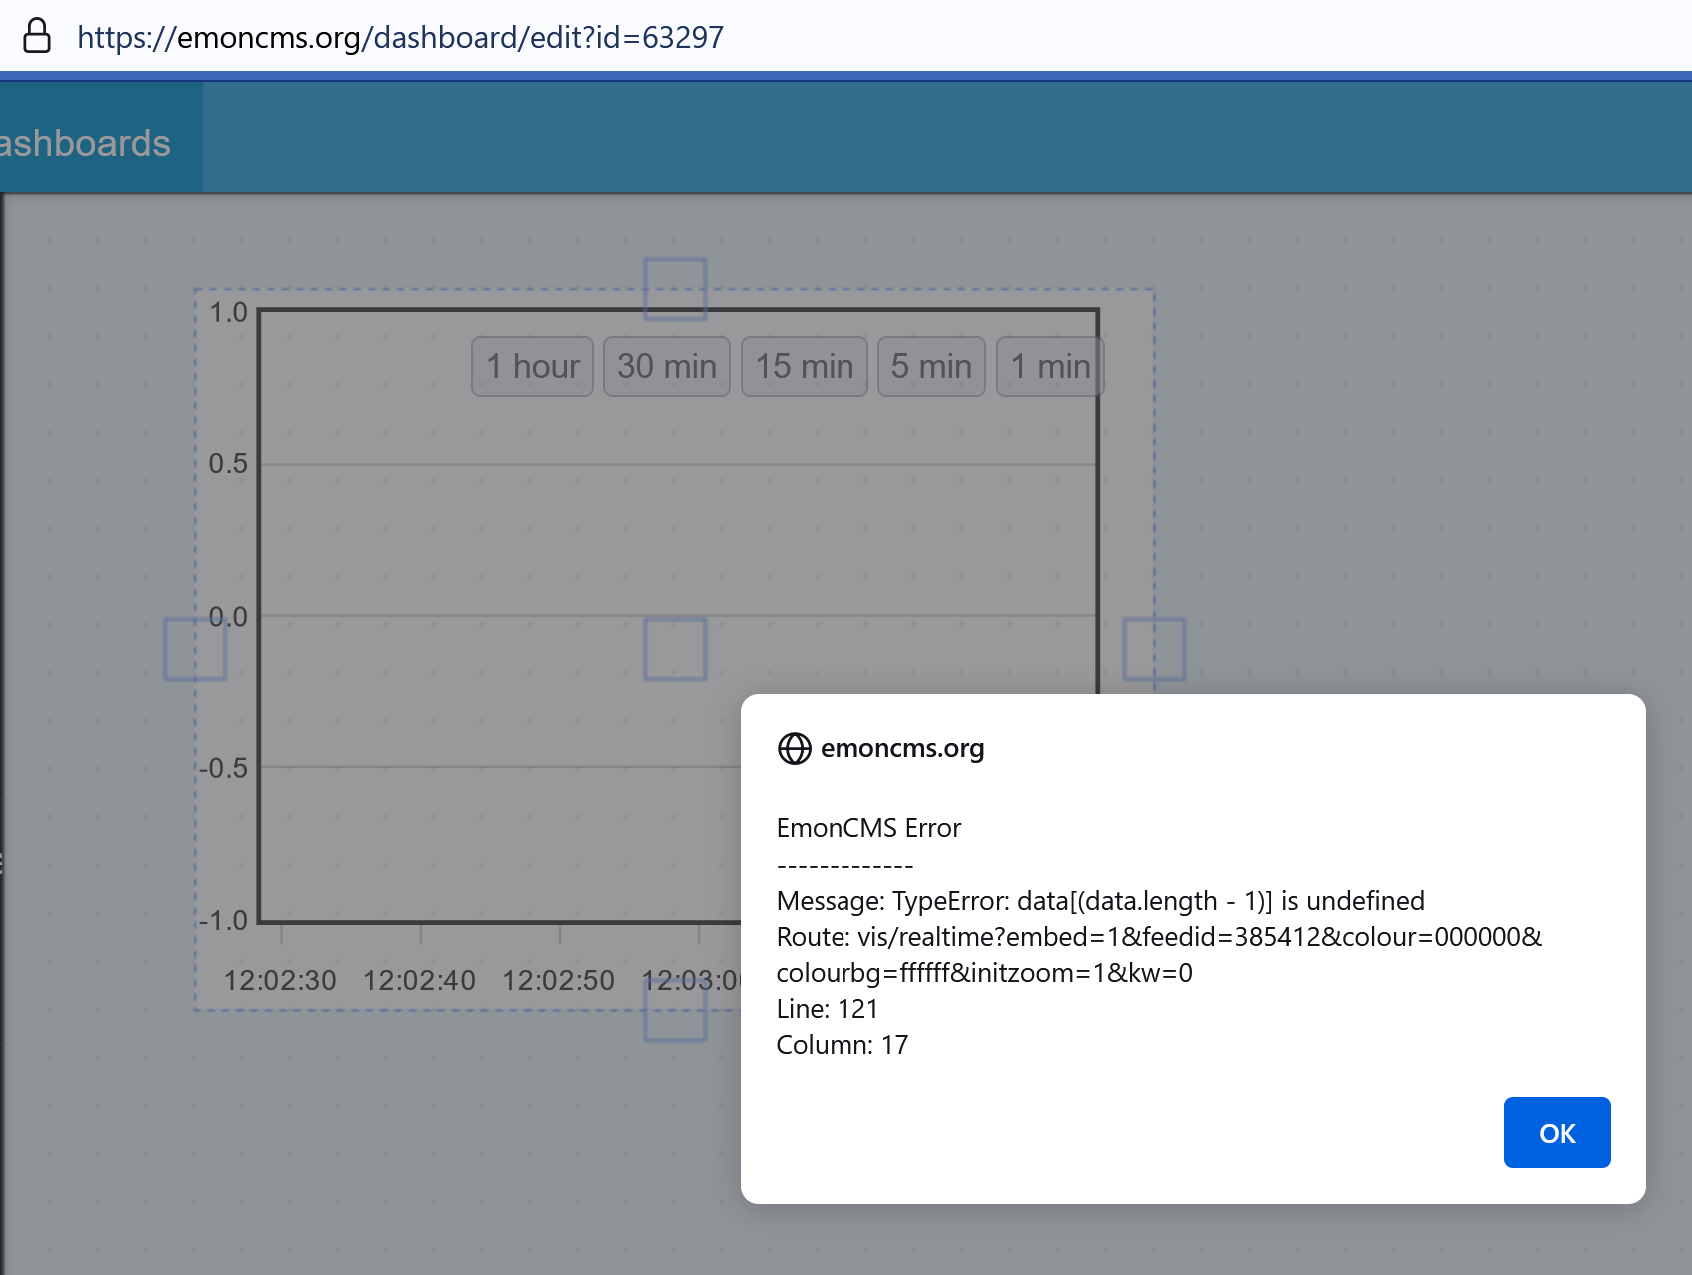
I created a new dashboard in emoncms.org and added a single object - a realtime visualisation. After 10 seconds I get the pop-up error message attached.
The feed in question has been used in previous realtime dashboards sucessfully, but those dashboards have stopped working and are now throwing similar errors.
I made the new test dashboard public so you should be able to see it at Emoncms - dashboard view
Hello @dmajwool I’ve improved the implementation a bit here, could you try again now? You may need to check the feeds selected for each graph to make sure they are referencing the correct feeds.
Hello @trystan.
I’ve tried again now and have stumbled across a solution that works for me, but maybe this is something that needs cross-checking by other users.
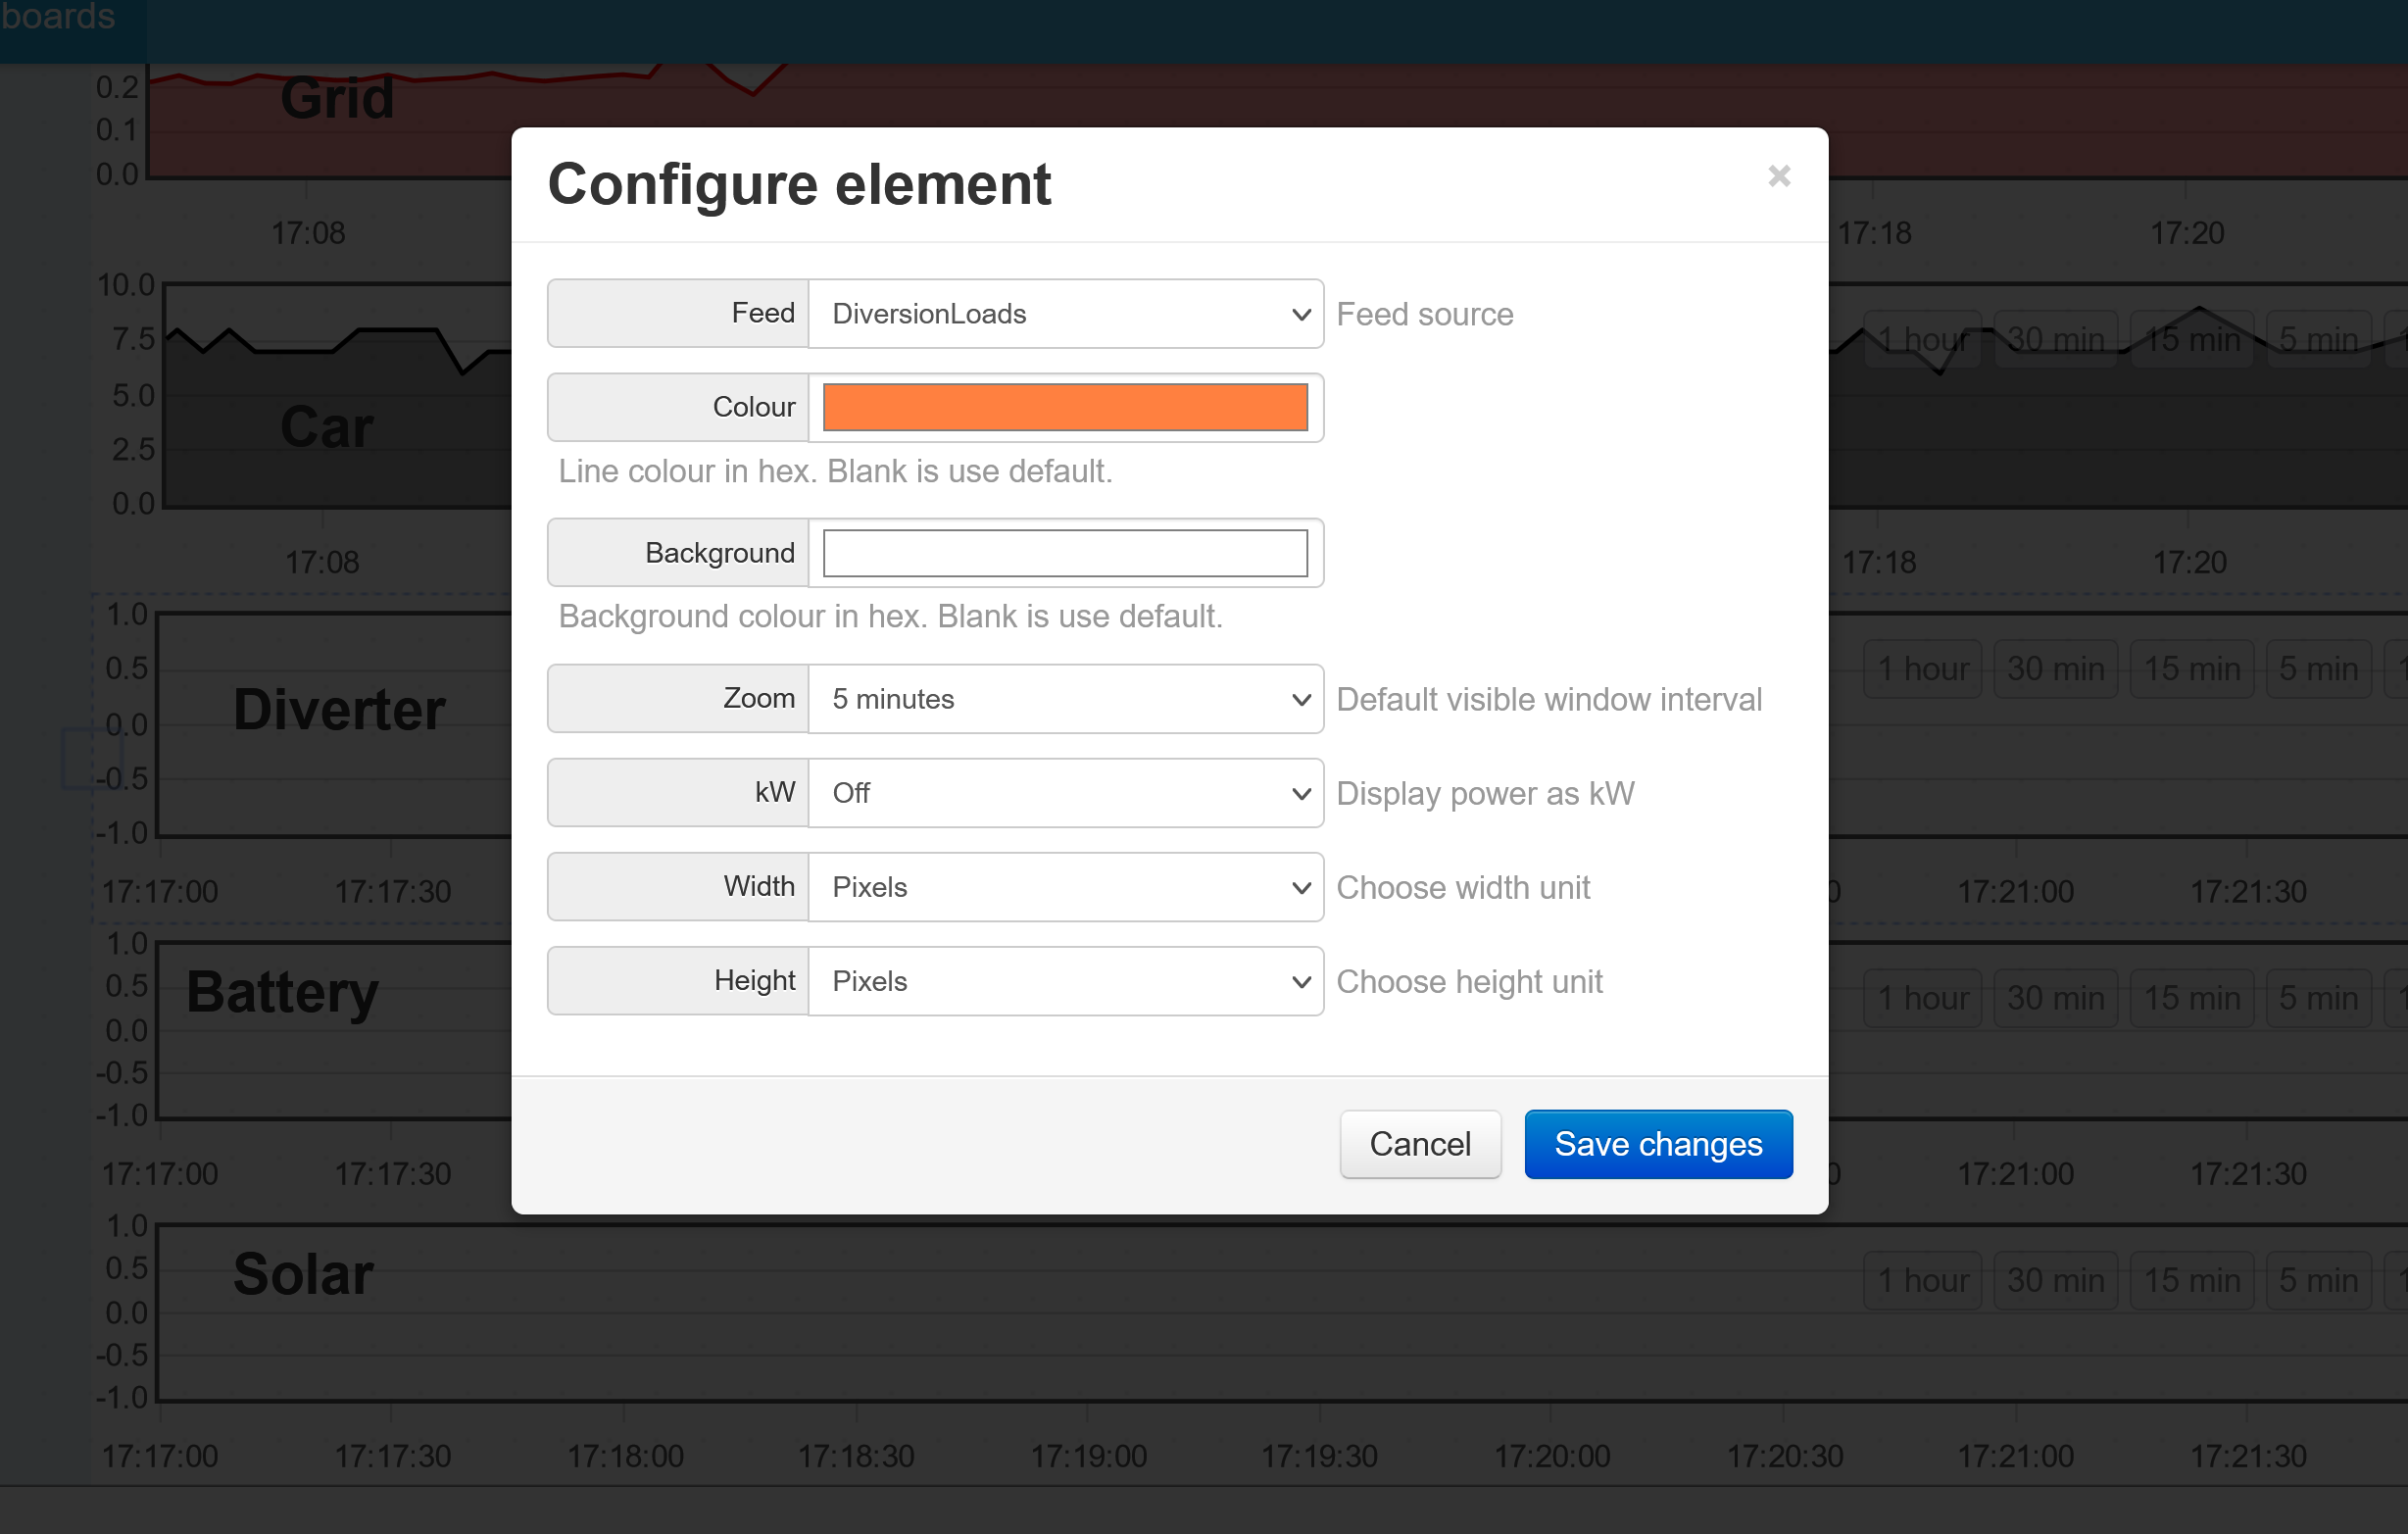
I found that my original dashboard (and other new temp ones that I created for testing) would only display the real-time visualisation at the moment they were opened if the Default Zoom level was set to 15 mins or longer. When the default was set to 1 minute or 5 minutes, no data was displayed on the scrolling visualisation when the dashboard was opened.
Whatever the default zoom level, data could subsequently be displayed by selecting whichever zoom is required after the dashboard is opened, including the 1 min and 5 min.
So I have set my default zoom levels to 15mins and life is sweet.