Hi,
I have had Emoncms running for some time on a local Raspberry Pi, but now want to create some dashboards to use the data more effectively.
What I would ideally like to do is a daily dashboard with a bar graph with one bar for usage between midnight and 06:00 am and another bar for usage between 06:00 am and midnight.
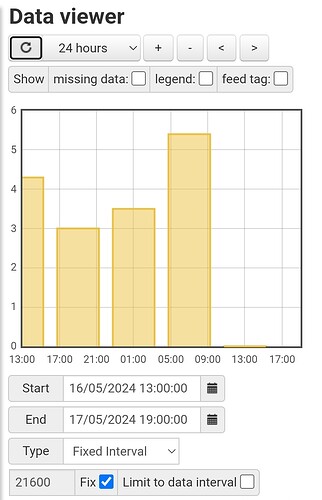
Using hte Visualization tool I have managed to create a bar graph showing data in 6 hour bars, but the start points are not fixed times, they show the last six hours and the six hours before that, etc.
Is it possible to create a bar graph for fixed intervals based on times? If the graph has to have four six hour bars per day that’s fine.
Thanks,
David


