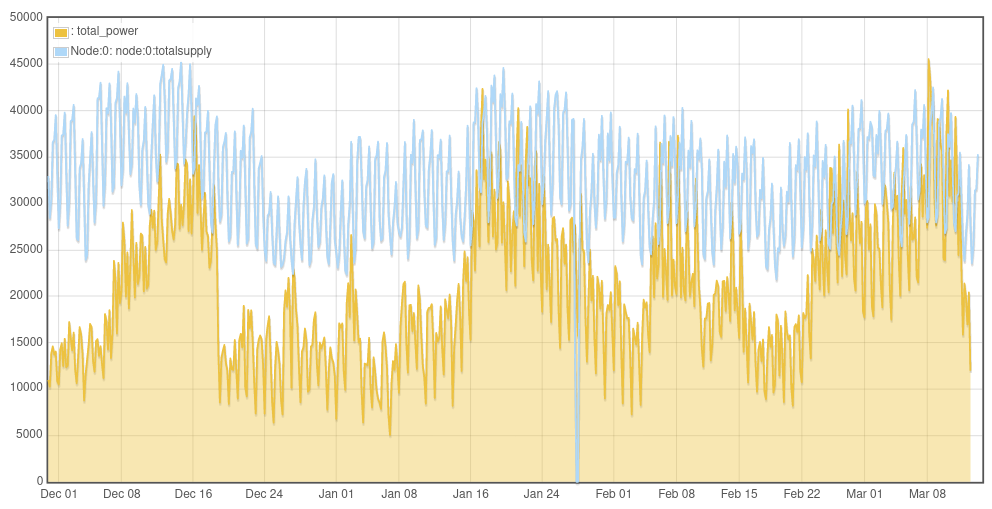
Im also recording UK grid data on another emoncms.org account here: Emoncms - feed view
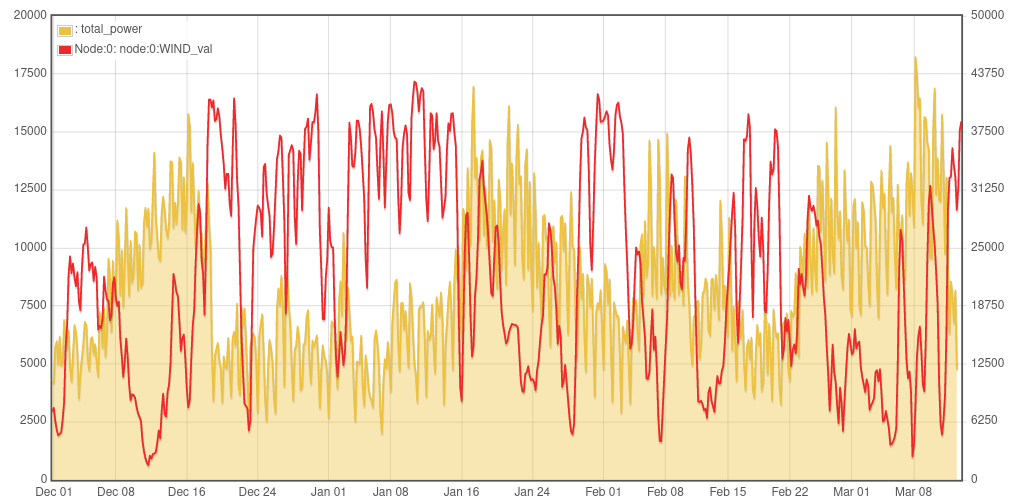
It’s possible to combine this dataset with the heat pump aggregation on a single graph by including the feedid of the uk grid dataset of interest. Here are a couple of examples, that highlight partly what we know already about low temperature periods also often being less windy:
UK metered wind output vs heat pump demand
https://emoncms.org/heatpumpmonitororg/graph/476418,97699
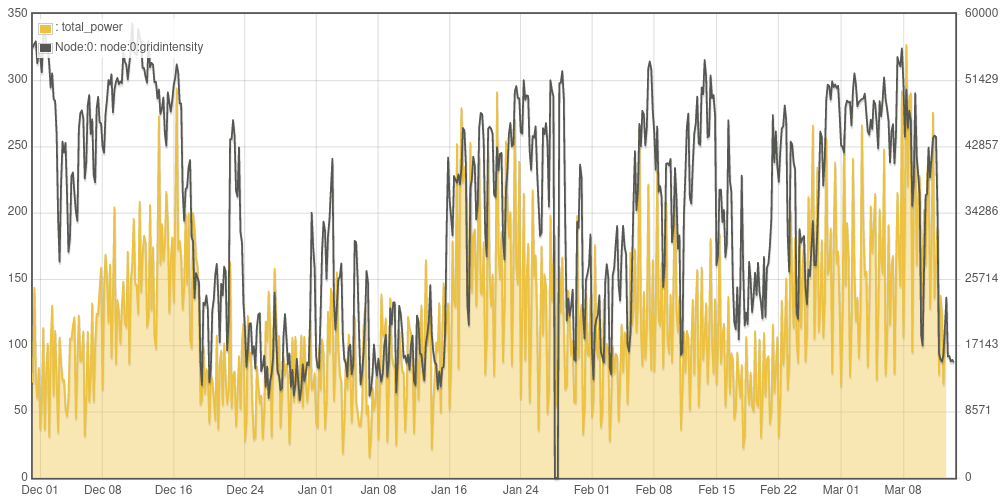
Not quite correct but indicative carbon intensity vs heat pump demand
https://emoncms.org/heatpumpmonitororg/graph/476418,97715
I need to check the carbon intensity calculation behind this one, it was based on one of the other sites recording carbon intensity but probably needs revising.
Total grid demand vs heat pump demand
https://emoncms.org/heatpumpmonitororg/graph/476418,97736