I seem to be having a similar issue and would appreciate any help / advice having got my system up and running on Tuesday 6th Feb as I’ve tried searching around a bit and am way out of my depth!
My issues seem to be
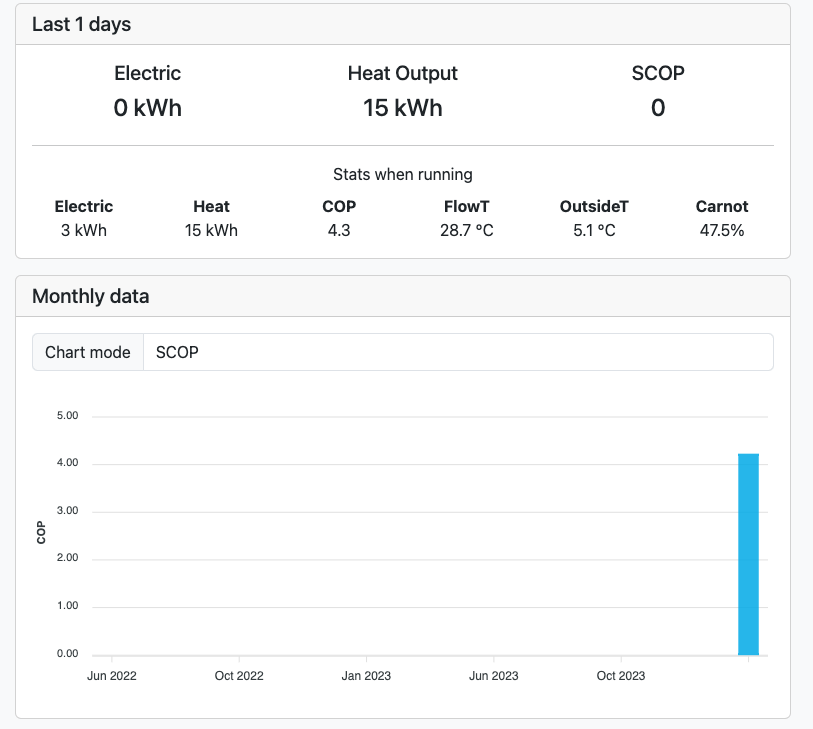
my system page indicates an SCOP of 0 but other data seems to be coming through ok
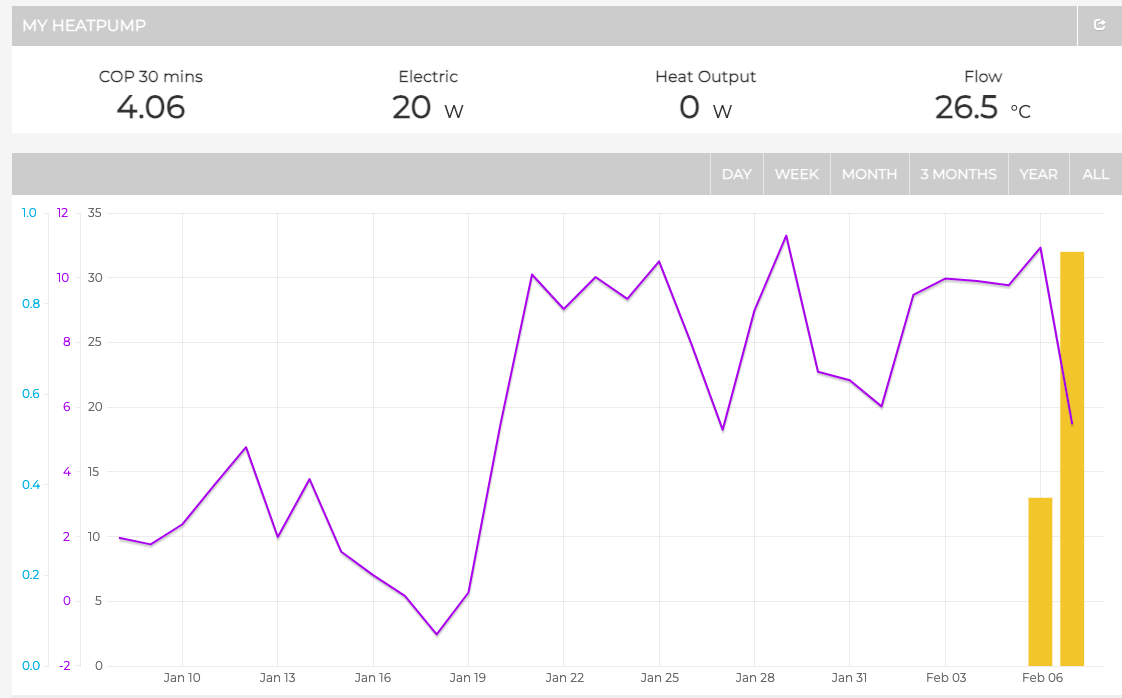
my emoncms graph does not seem to be picking up my electricity consumption (e.g. no blue bars) and so it can’t show COP on the graph, but it does seem to be calculating COP
on the heatpumpmonitor page my setup appears (Bristol Arotherm+ 5 kW) but indicates 0.0 COP and 0 days of data, even though yesterday it definitely was pulling through a COP!
Note, my heat meter was installed back when the heat pump was installed in November but my electricity metering was only installed on Tuesday, I’m not sure that has anything to do with it.
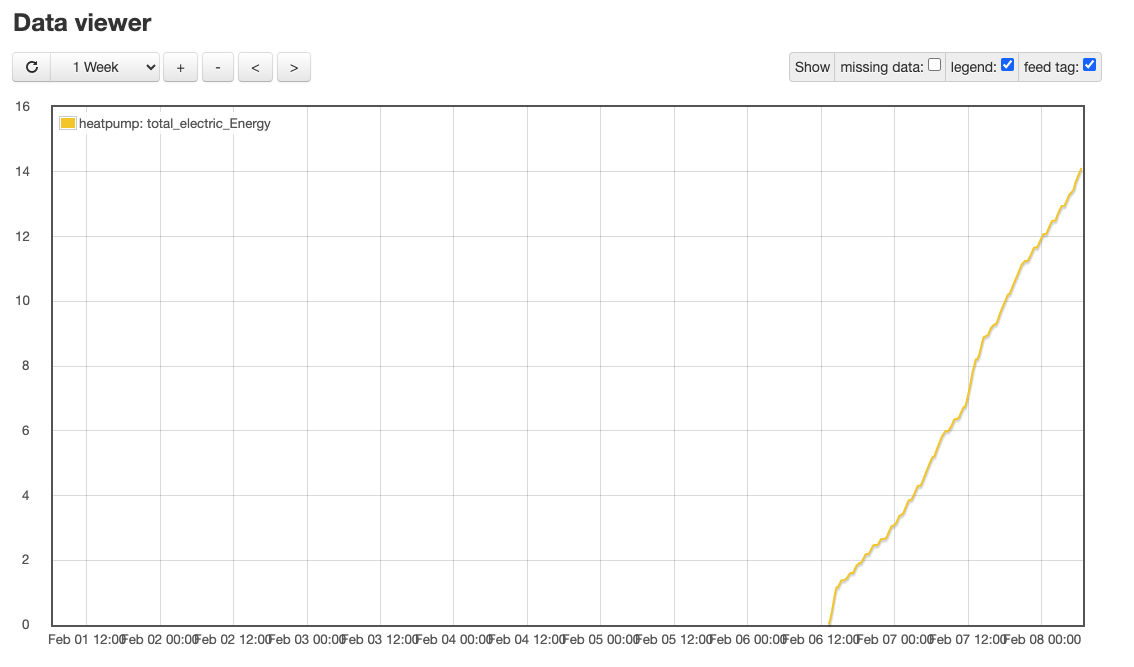
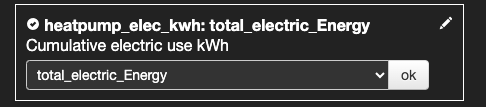
You need to check the heatpump_elec_kwh feed (known to you as total_electric_Energy), as it’s returning nulls instead of values. The other feeds look fine, but that one isn’t working.
Hi Tim, thanks for your quick response!
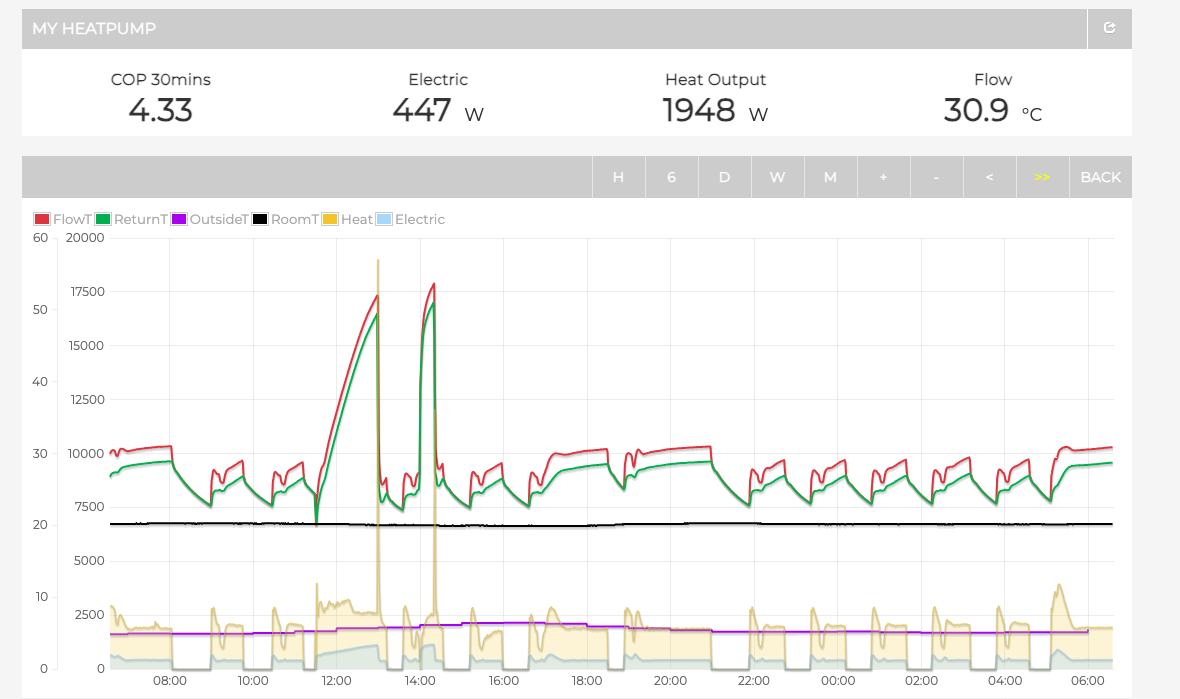
I should have said in my first message, the electricity is being pulled through when I click to view e.g. Day. The feed does seem to be set up correctly (e.g. heatpump_elec_kWh = total_electric_energy) and is set to public
Looking at the data in the feed, there seems to be some missing values near midnight. Is there something happening at that time which is interfering with readings?:
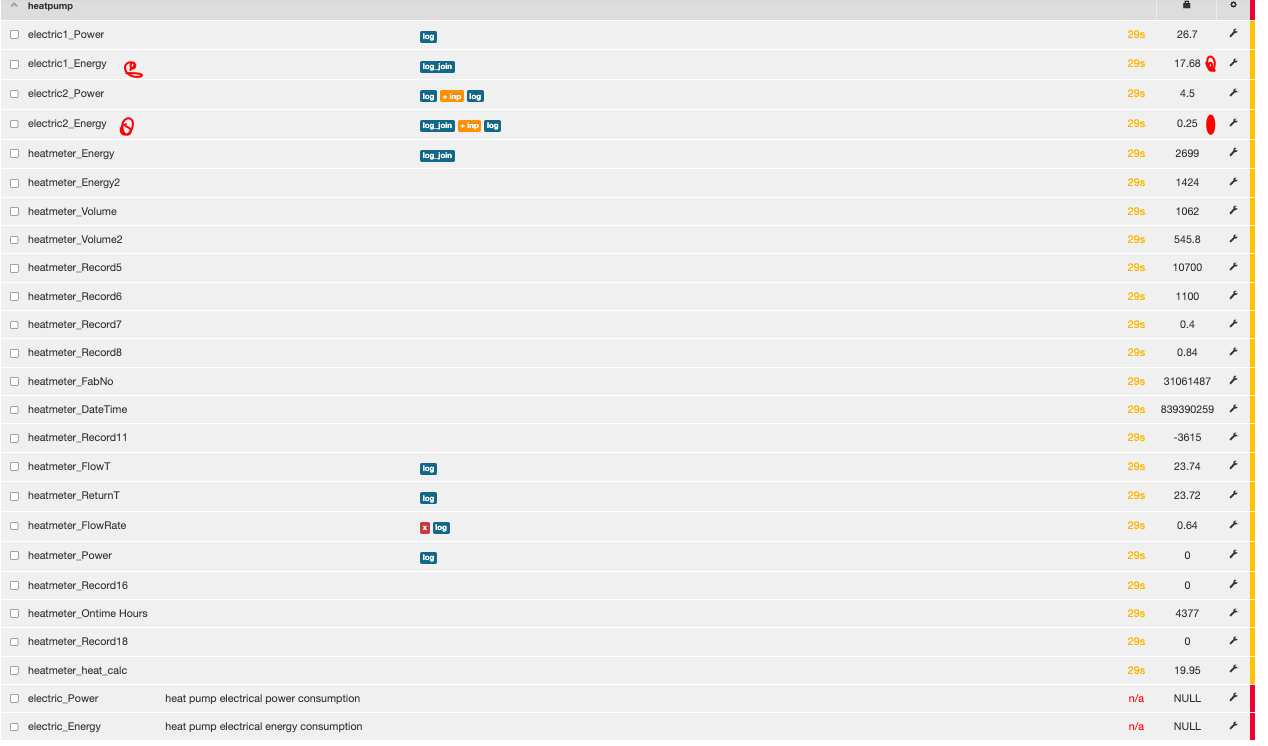
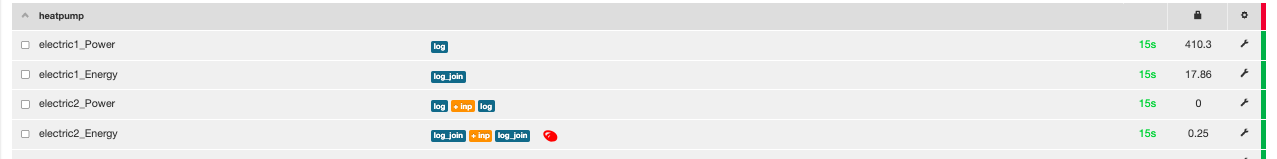
I have inputs electric1_energy and electric2_energy which do add together to make the sum of total_electric_energy in my feed. They update pretty regularly, maybe 60s? Whatever the default is because I haven’t changed anything (knowingly)
I do also have 2 null feeds at the bottom of the list
That looks good. Doesn’t explain the missing values, but should mean there’s no gaps from now on. Should start seeing a blue bars on My Heatpump app after midnight, and COP on HPM site.
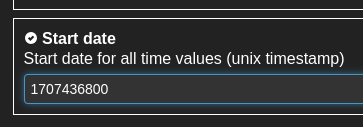
It might be worth setting the Start date to 1707436800 in the app, so that values before midnight are ignored and don’t skew the results.