Is there anything that can be done to control the auto Y-axis scaling for powers in the Heat Pump?
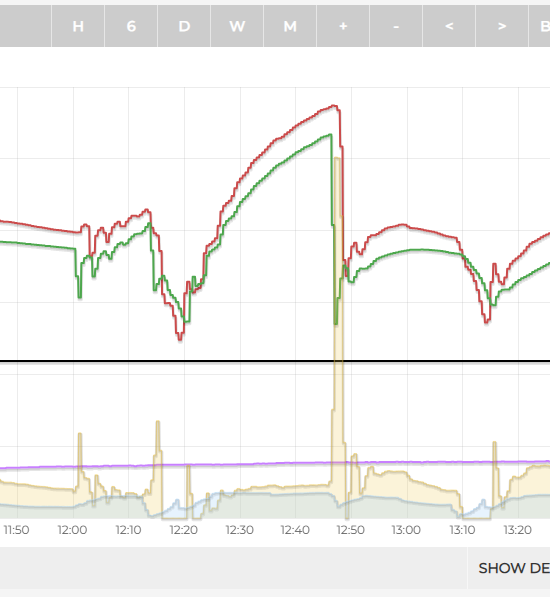
My system creates these massive spikes in measured output power at the end of a DHW cycle, due to a long primary pipe run, and the large temp difference between the return temp (now coming from the rads) and flow temp (still at DHW temperature). This is real power going into the heating circuit - but it causes the electric power and heat power lines to be scaled such that the normal, steady-state, conditions are compressed down at the bottom of the Y scale.
Is there anyway to control the Y-axis scaling to avoid this?
Hello @Martin_Robinson I’m afraid there isn’t a way to control this at the moment - at least within the MyHeatpump app. Looks like the spikes are particularly high on your system! I’ve added an issue about this here MyHeatpump app power view y-axis range · Issue #213 · emoncms/app · GitHub
Thanks Trystan.
I don’t think my system is that unusual?
I have perhaps as much as 20 meters of 28mm primary pipe between the DHW cylinder/heatmeter and the outdoor unit - each way. Pipe runs up to loft from 1st floor airing cupboard - then across two bedrooms - down the outside of the house - across a path - another couple of meters to the HP itself. This of course is not ideal as there is a fair bit of heat stored in all that pipework - about 20 litres of hot water. The DHW cylinder itself is only 120l, so there is quite a high proportion of DHW energy used just to heat up the primary pipe contents, which is then wasted or dumped into the radiators at a very poor COP.
It’s even worse when it does a defrost in the middle of a DHW cycle!
This is I guess a downside a Heat-Geek ‘zero disrupt’ install reusing an old cylinder which does not have a large area coil, causing flow temp to get rather high (65 degrees!) when heating the tank to 50.