Would you ever consider asking them whether we can do anything useful with the MAC-567IF-E HTTP interface and whether they’d enable EchoNetLite like the NZ users get, so we’re not hammering their melcloud as much and we don’t lose access when our internet link hiccups?
Yes. I’ll include that in the list of things I ask them. One step at a time ![]()
1 Like
I am very sure that my heat pump data updates every minute, and always has (except when it doesn’t). Here’s a screenshot of Hourly Temperature report from MELCloud:
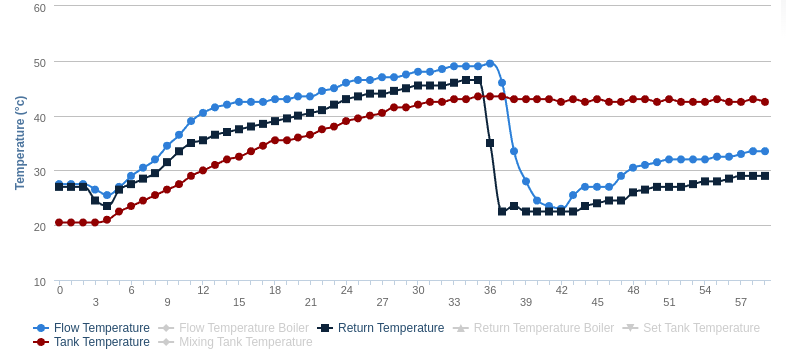
Now, even with two-minute update interval I think MELCloud will still plot 60 points per hour, by interpolating ever other point. But looking at the Tank Temperature above, there are definitely distinct values which couldn’t be interpolated.
I note that MMSP requires measurements to be recorded every two minutes (or less).
My internal unit has the model number PAC-IF073B-E, which appears to be supplied with FTC6.
I’ve tried hacking into the local web interface to see if I could get data that way, but to no avail. I even looked at meldec and tried the packet sniffing, but it looks like Mitsubishi are now encrypting the traffic. So yes, would love to be able to read it directly.
1 Like
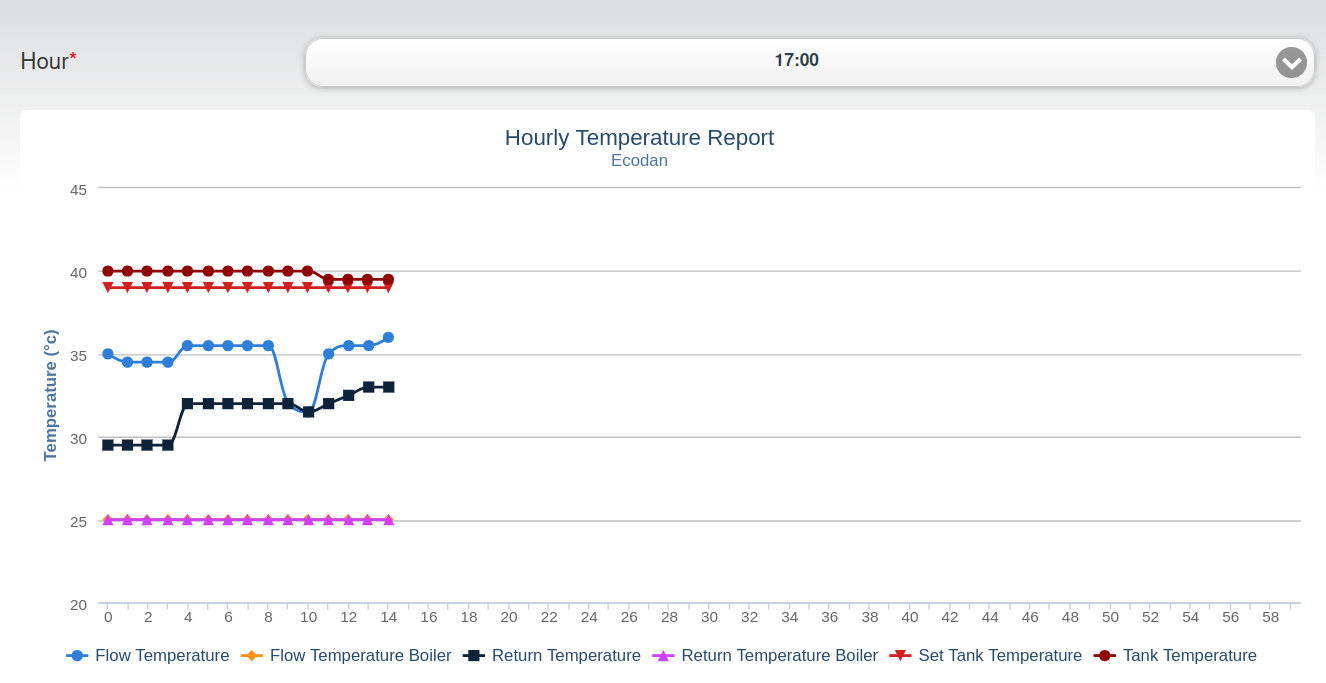
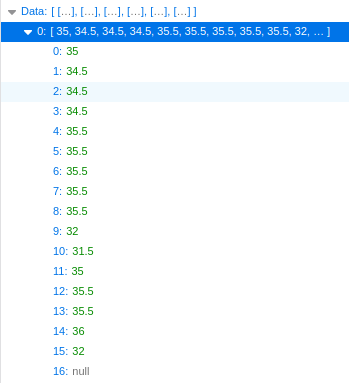
Here’s a concrete example where I inspected the JSON behind one of those hourly reports.
a            35.5,
b            36.0,
c            37.0,
d            36.0,
e            36.5,
If a and c are real readings then we could imagine b was interpolated. However that would mean c and e are real and d is interpolated and that clearly can’t be true because it’s lower than both.
If b and d are real then c is interpolated, but clearly can’t be true either because it’s higher than both.
Of course we’re assuming linear interpolation here, but speculating there’s a higher-order polynomial would be madness. Surely?
It’s tempting to think there’s a mis-understanding where we are talking about device → MELCloud, or MELCloud → UI and our chums at Mitsubishi are talking about some other link but I can’t for the life of me imagine what it would be.
It may just be that the reporting endpoints and the ListDevice endpoints are different things in MELCloud land and so this analysis of the reports we see in the UI is a red-herring.
I don’t know what to think at the moment.
It would not surprise me if they were showing you screenshots from their MMSP spreadsheets, which are possibly exported from the real data at the reduced rate.
Perhaps, but I’m also seeing variation of data in ListDevices every minute too. Specifically in OutsideTemperature (which is only to nearest degree, and sometimes oscillates) and CurrentEnergyConsumed (which at idle shows 1 Wh being used every 3 minutes or so):
10:36:00, 0
10:37:00, 1
10:38:00, 0
10:39:00, 0
10:40:00, 1
10:41:00, 0
10:42:00, 0
10:43:00, 1
10:44:00, 0
10:45:00, 0
10:46:00, 1
10:47:00, 1
10:48:00, 0
10:49:00, 0
(adds up to 20Wh over an hour, i.e. ~20 watts of power on standby)
Have you tried polling every one minute (and not a second sooner)?
Well, this is a bit sad.
I’m now running your script. It has not magically fixed my problems.
If I run your script every 61 seconds it still comes unstuck. If I run it every two minutes it’s happy.
I tried with / without the sleep. That doesn’t change the actual time between calls to the API.
I tried with / without the LastTimestamp (a.k.a. stale data) check. That occurs after the call to MELCloud so it doesn’t impact the behaviour.
I tried with / without new key generation. This might have helped, but it didn’t. By default it merrily keeps using the same key so I don’t think you are re-generating the key often.
Your poll-backoff overnight would help, but that would not fix my daytime problems.
Your CurrentEnergy* fun is quite interesting. I was just trusting the stats in the other fields.
You do have a bit of jitter caused by fetchLastValue but that comes after the API call. Seeing as you are kicking off the job every minute from an external process (assumably cron) it means you aren’t impacted by that jitter. You would be if your script was going in a loop with a sleep(60) for example.
Your fetch is a single API call, I’m doing three. I was hoping your simpler approach would mean it was less likely to trouble the servers.
Given all this I’m not sure what to conclude. You clearly have per-minute data.
In addition I have a rather confusing situation here. My “sum of bits of energy” is giving me the correct total (it matches MELCloud) even though I’m only seeing half the readings and I don’t think the readings are being “doubled-up”. Still investigating that.
I put this in when I realised that MELCloud was attributing the standby energy to whichever mode it ran last [issues/19] and I really wanted to separate out the idle power to better understand it.
I can only suggest polling every 2 minutes for now, and in a week or two try again with 1 minute interval. This is what I need to do on occasion, when the servers get in a huff with me. A new context key might help at this point, but I have no evidence to support that theory yet.
(brain wave: maybe alternating between two context keys might work???)
This is because we’re converting the Energy into Power (Wh x60 => W), and then getting emoncms to convert that back with Power to kWh process step. Any gaps (nulls) in the power readings are correctly accounted for, so that the overall power consumption/production is mostly correct. The errors will be pretty small, and will probably average out to nothing much.
Had we been accumulating “bits of energy” directly, then we would have been missing half of it.
Well, that’s funny @Timbones
I had COVID when you posted that and my brain was so fuzzy I couldn’t understand it. Luckily my head is working again!
Very nicely said. We’re getting a power reading that was accurate at one minute and it stays that way until a new reading turns up two minutes later. It will have been incorrect in the interim, but not by enough that we can easily identify it.
ofc the docs are lovely: Calculating Daily kWh — OpenEnergyMonitor 0.0.1 documentation
So I probably need to work out if I’m going to care about the gap. It’s been a year and I’m clearly getting nowhere.
I did just try a bunch of changes to how I poll and I still can’t get the servers to give me fresh updates each minute. Maybe I’ll change my device ID it’s posting to and get my heat pump to post to your account ![]()
I even managed to break it just by using https://app.melcloud.com/ by just refreshing it manually like a regular human. The server is clearly receiving updates each minute and is able to create the server-side data structures, it’s just the caching on the API for ListDevices (and maybe some others) which is causing stale values to be held onto if you make a request too often.
For kicks, here’s the report chart changing whilst I refreshing MELCloud every 30 seconds (manually in a browser!) and got the same values back on the MELCloud web client for all the time in the graph ![]()
It’s quite clear the server-side data changed at 10, 11 and 12 past and we can see it in the data structure feeding the report graph:
ofc I did update my code to consume that report graph data so I got fresh values for each minute, but it’s only a few attributes so I wasn’t keen on using it.
On the bright side, for those people using MBUS, at least they aren’t having to put up with this nonsense ![]()
1 Like
During this cold month of December, I’ve looked at how much energy I’m actually using to heat the home, and worked out the Heat Transfer Coefficient. This method gives me a value of 290 W/K, which is perhaps closer to what would be expected for this kind of property.
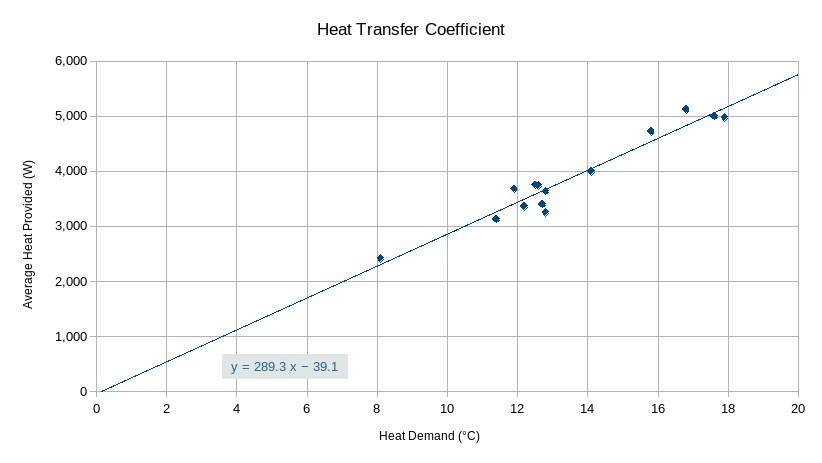
I’ve since changed to a more typical formula for weather compensation, i.e. gradient and an offset. Using trial and error I’ve tweaked the parameters until it feels right, and have something works nicely so far this season. [I’ll do a proper writeup some day]
Interestingly, heat loss / heat output using the coefficient I got above gives me exactly the same gradient as I was already using for the weather compensation. So that’s reassuring.
1 Like
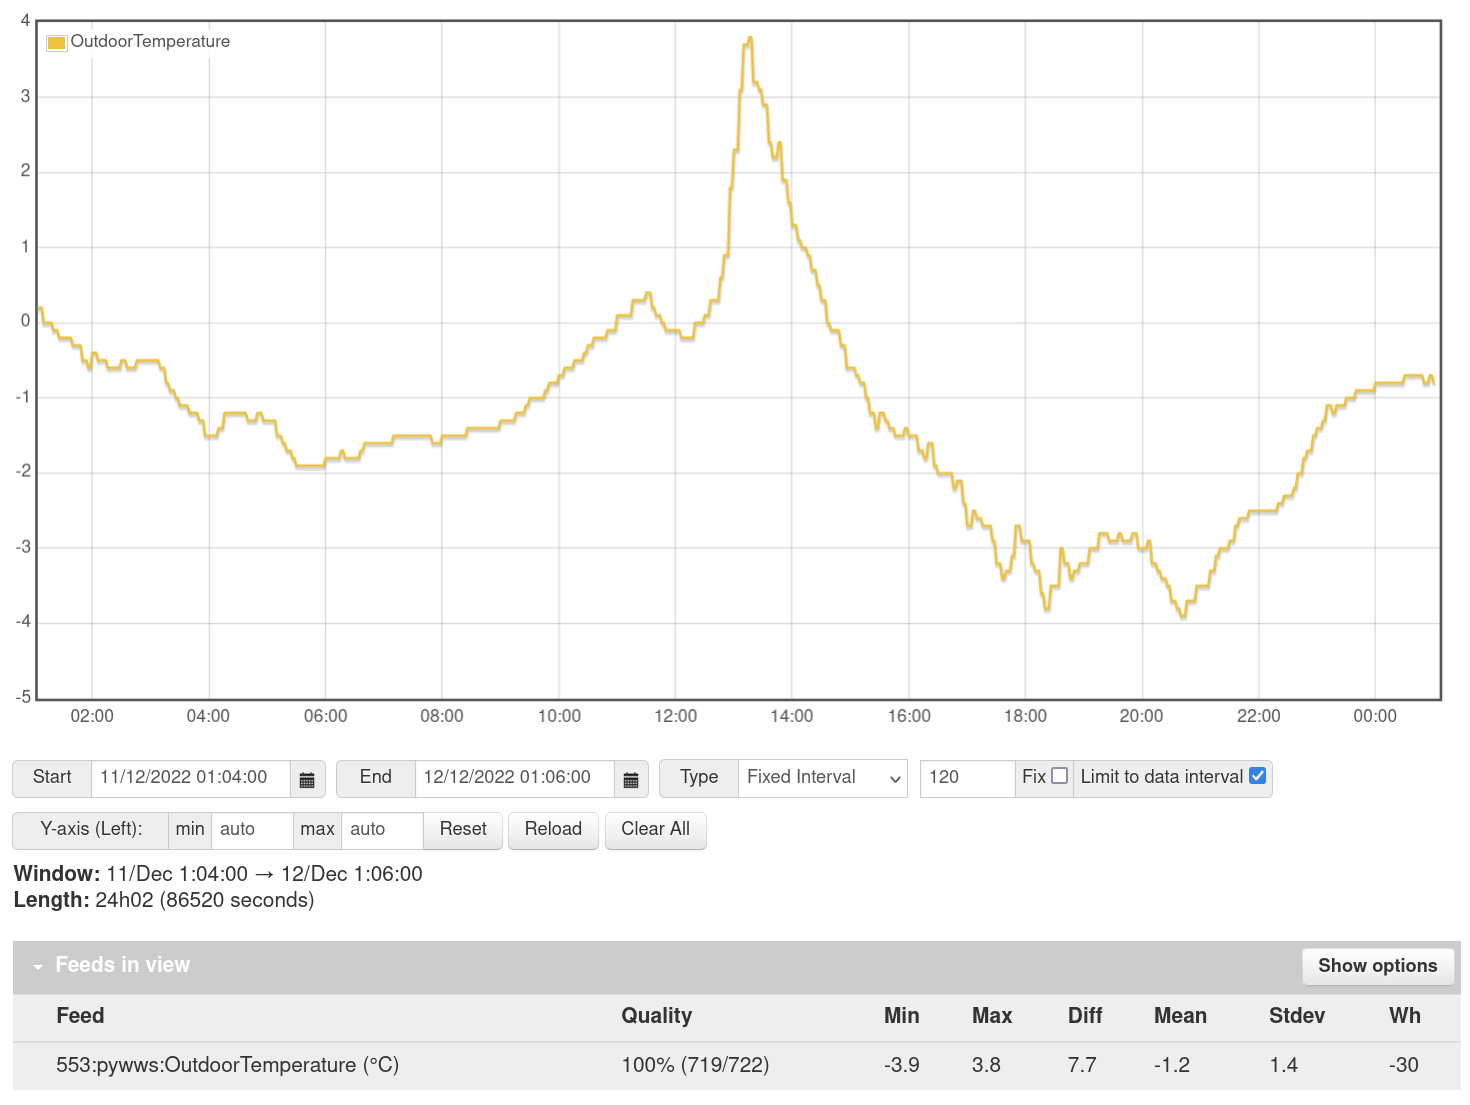
At a mean external of -1.2 °C:
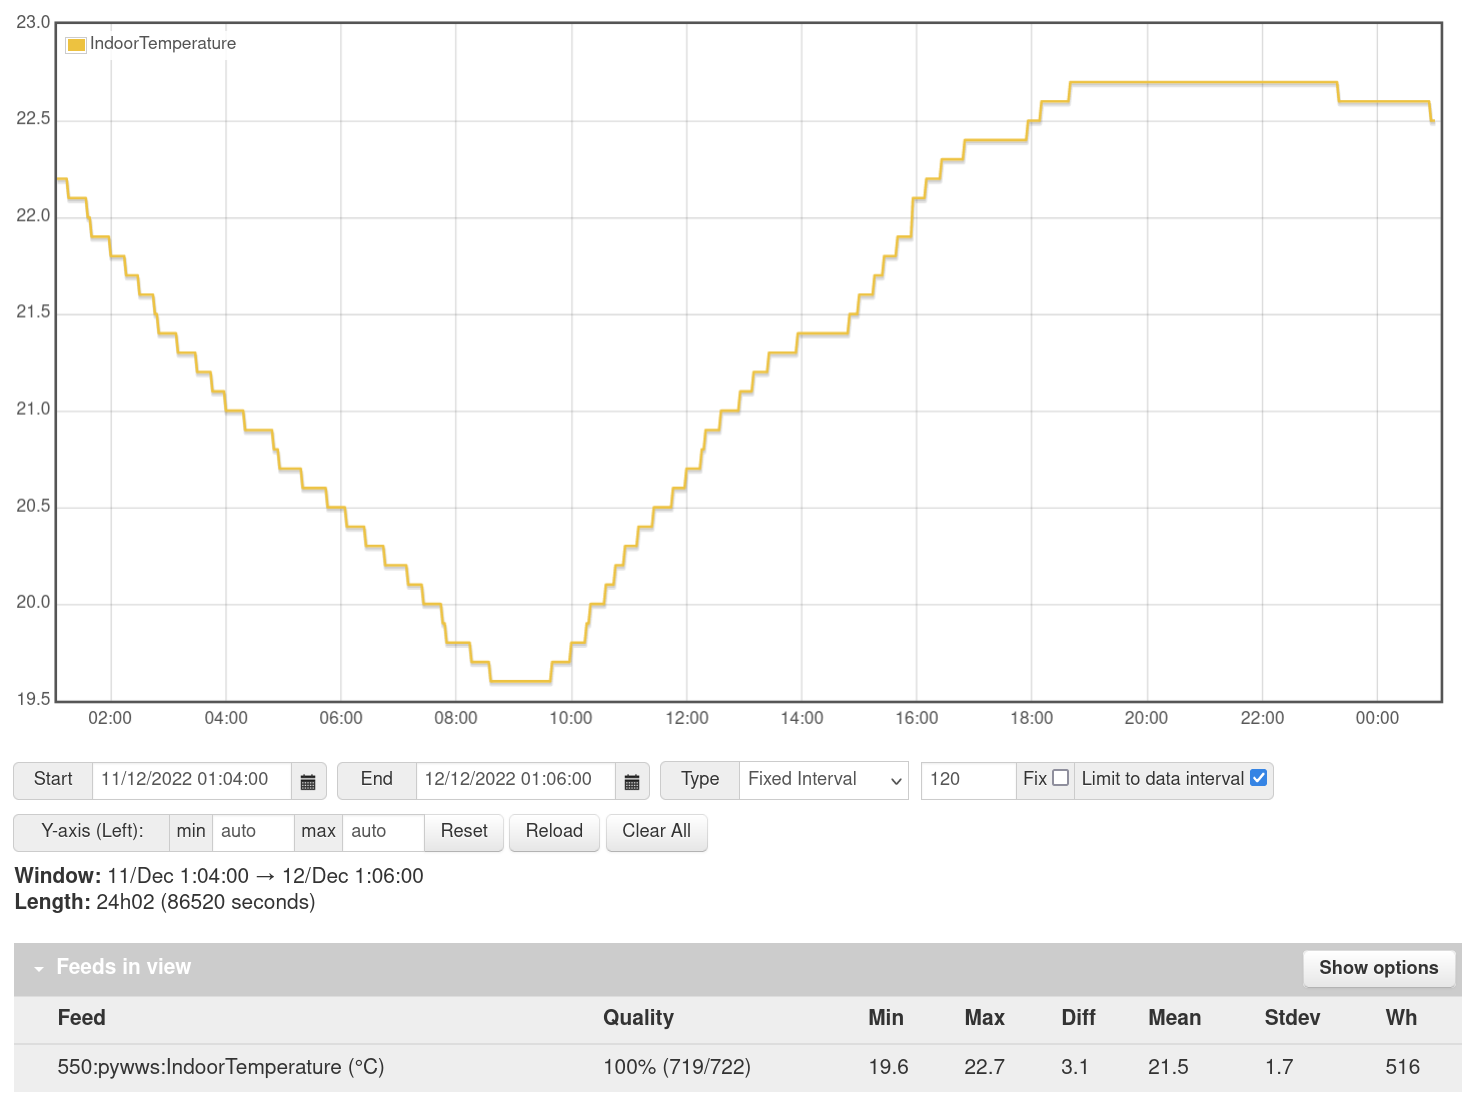
and a mean internal temperature of 21.5 °C:
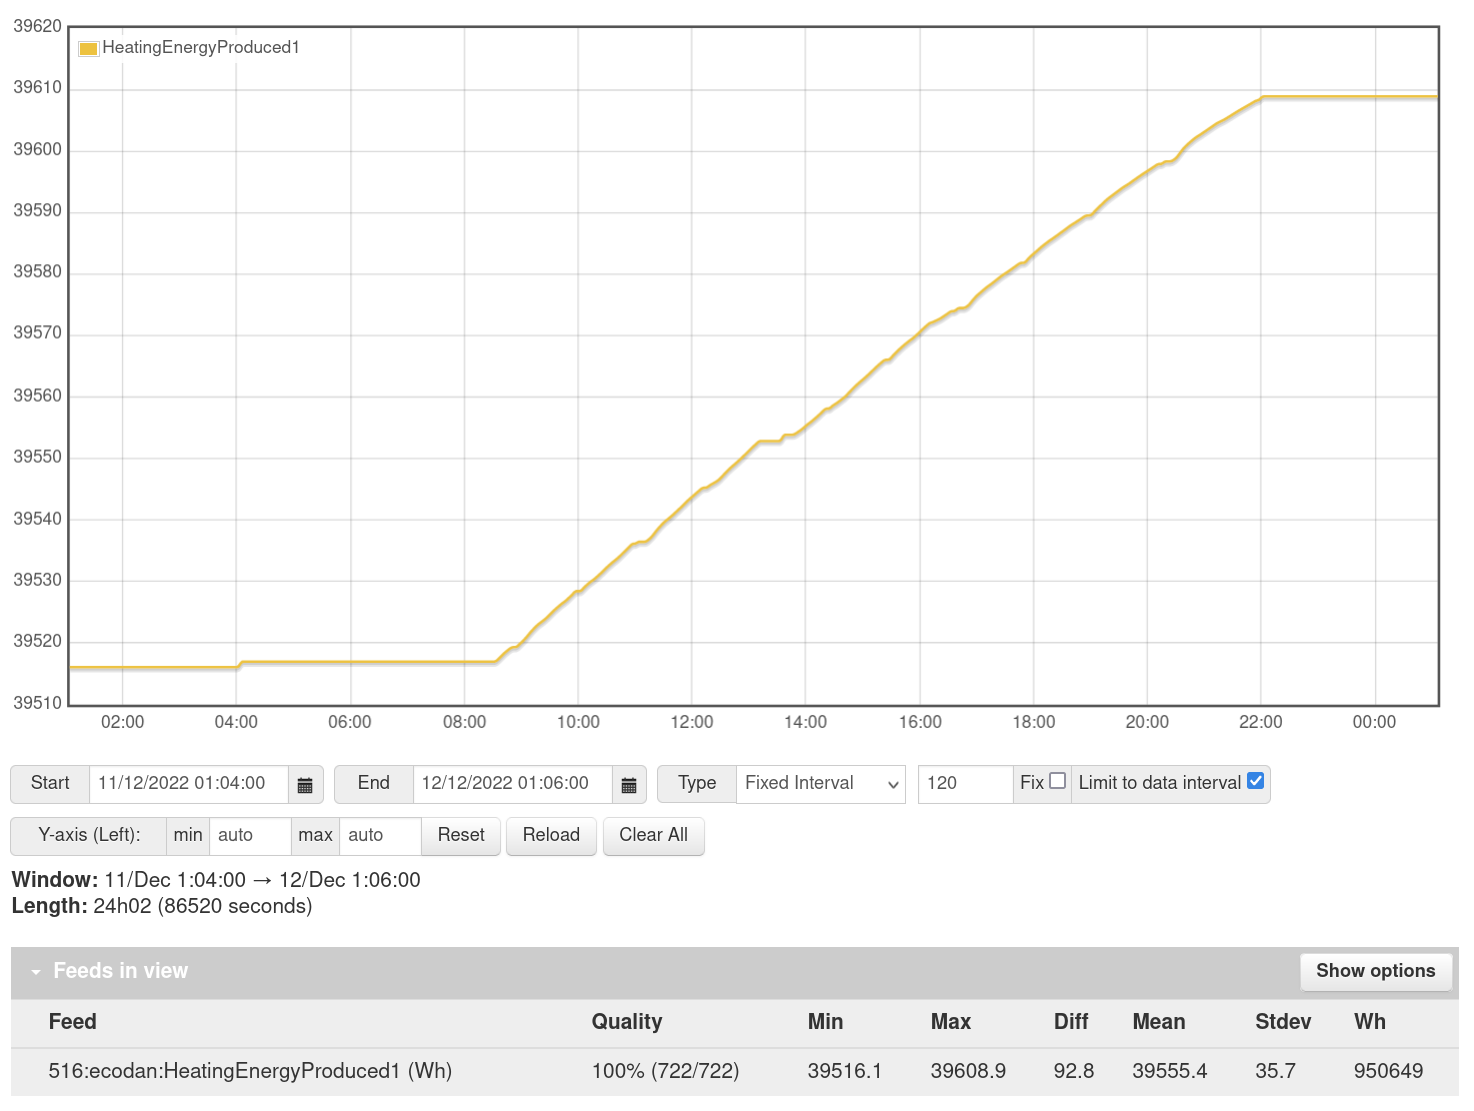
we had 92.8kWh of space heating:
Or to put in another form (we only use space heating when electricity is expensive):
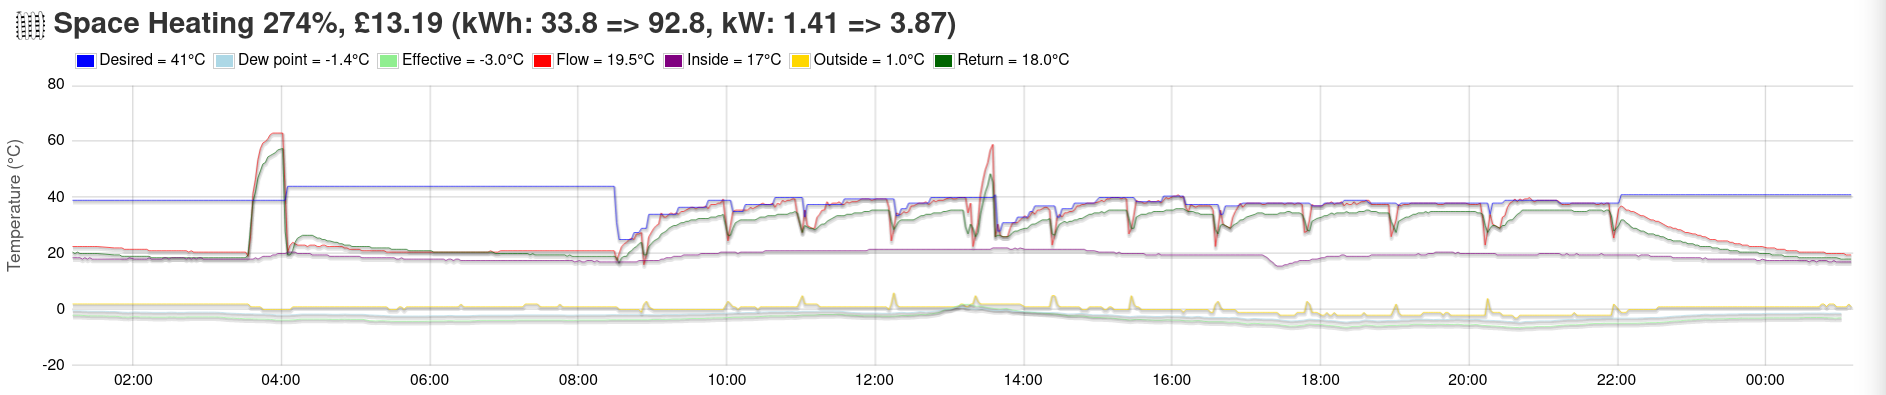
So that’s a 22.7 °C temperature difference and 3.87kW => 170W/K
I’ll claim about another 20kWh internal house electrical usage (the car used 42kWh!) => 112.8kWh which gives 207W/K which is rather lower than we’d expect for this solid-wall house. I’ll need to do something more like your analysis where I do this over a number of days. I don’t currently have a way to automatically work out what the car is consuming so it’s hard to get a handle on the internal usage. Using your technique will help gloss over this by just assuming the base contribution is somewhat constant and not actually worrying about the natures of the inputs.
1 Like
Sorry to bring up an old thread but @MyForest could you explain what the effective flags are and how you and others have worked them out?
I would like to change the value of MinSetTemperature and MaxSetTemperature and have been looking at code used by others (e.g. pymelcloud) and see that I need to also set the effective flags value but don’t know where it comes from.
Hi @ajdunlop
(I’m totally OK with you bringing up old threads, I’m going to be here for another 50 years)
We’re all just reverse-engineering them from our interaction with MELCloud.
Here’s my list:
It would be really wonderful to have an API published by Mitsubishi (or their technology provider) but I’ve been told that’s not going to happen so we need to take the situation into our own hands seeing as we’ve paid hundreds of pounds to get access to the MELCloud service.
MyForest
1 Like
As these aren’t settings that can be changed from MELCloud, I don’t think you’ll be able to change them via a script.
Is this for DHW? What are you hoping to do with them? Can you not use SetTankWaterTemperature instead?
1 Like
Sorry to bring this pain point up again; have you seen any change to your polling rate?
I recently helped a fellow Ecodan owner get data from their heat pump through Melcoud. To begin with, they added me as a guest to their account, which meant that my account could see their heat pump. Requesting data from Melcloud would then give me two buildings and two devices to parse. Interestingly, polling every minute would result in stale data from their device, but not mine. I then switched to polling their account directly, and it is still restricted to every other minute.
Incidentally, my account “broke” for the last week in February, forcing me to skip minutes until it would start working again. I find this happens to me every few months, but is fine the rest of the time. (This will be little comfort to you, sorry).
Tip: Change the process from “Log to feed” to “Log to feed (Join)” to interpolate the missing points in the feed. The line charts will look the same, the cumulative energy measured is unchanged, but your Efficiency bar charts will look like more contiguous. They’re gonna be smoothed anyway.
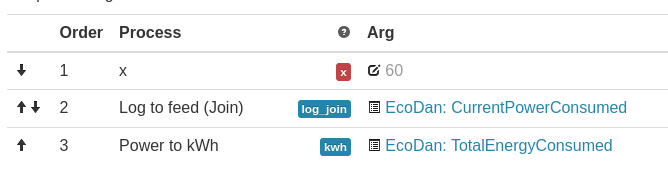
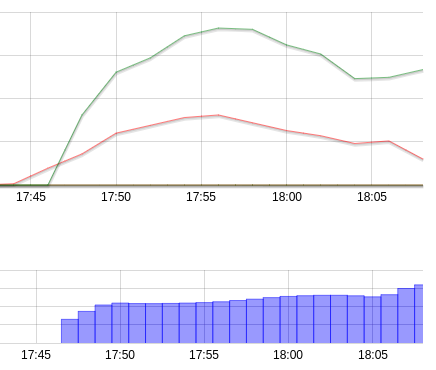
(Data sampled every two minutes, but looks like it’s every minute)
1 Like
Actually I think that’s part of what I broke yesterday. For four hours I got practically the same readings back. That’s why I posted the MELCloud screenshots because the data on their servers did vary, but the data I got from the API didn’t. Sad face.
So I think I’m still very much stuck and sadly Mitsubishi told me they aren’t going to help any further.
Unfortunately I’m being obstinate and not doing that. I want the stored data to reflect actual observations, but then I’m OK with interpolating or smoothing or other nonsense at higher layers. I’m just self-flagellating with the gaps in my charts.
I’ve seen my control being more sketchy over the last few days as I’m trying to be more specific about what I’m doing. Having the data on a two minute cycle is making it struggle. Some of my other data is on a six second cycle and that’s nice ![]()
2 Likes
I was just about to ask if anyone was in a position to compare the reported consumption values from MELCloud with self-monitored data, so thanks for that. Especially as MELCloud reports that my system “does not have an energy consumption meter fitted”, despite the fact I’m clearly seeing meaningful consumption data returned from HTTP requests.