Today’s moan
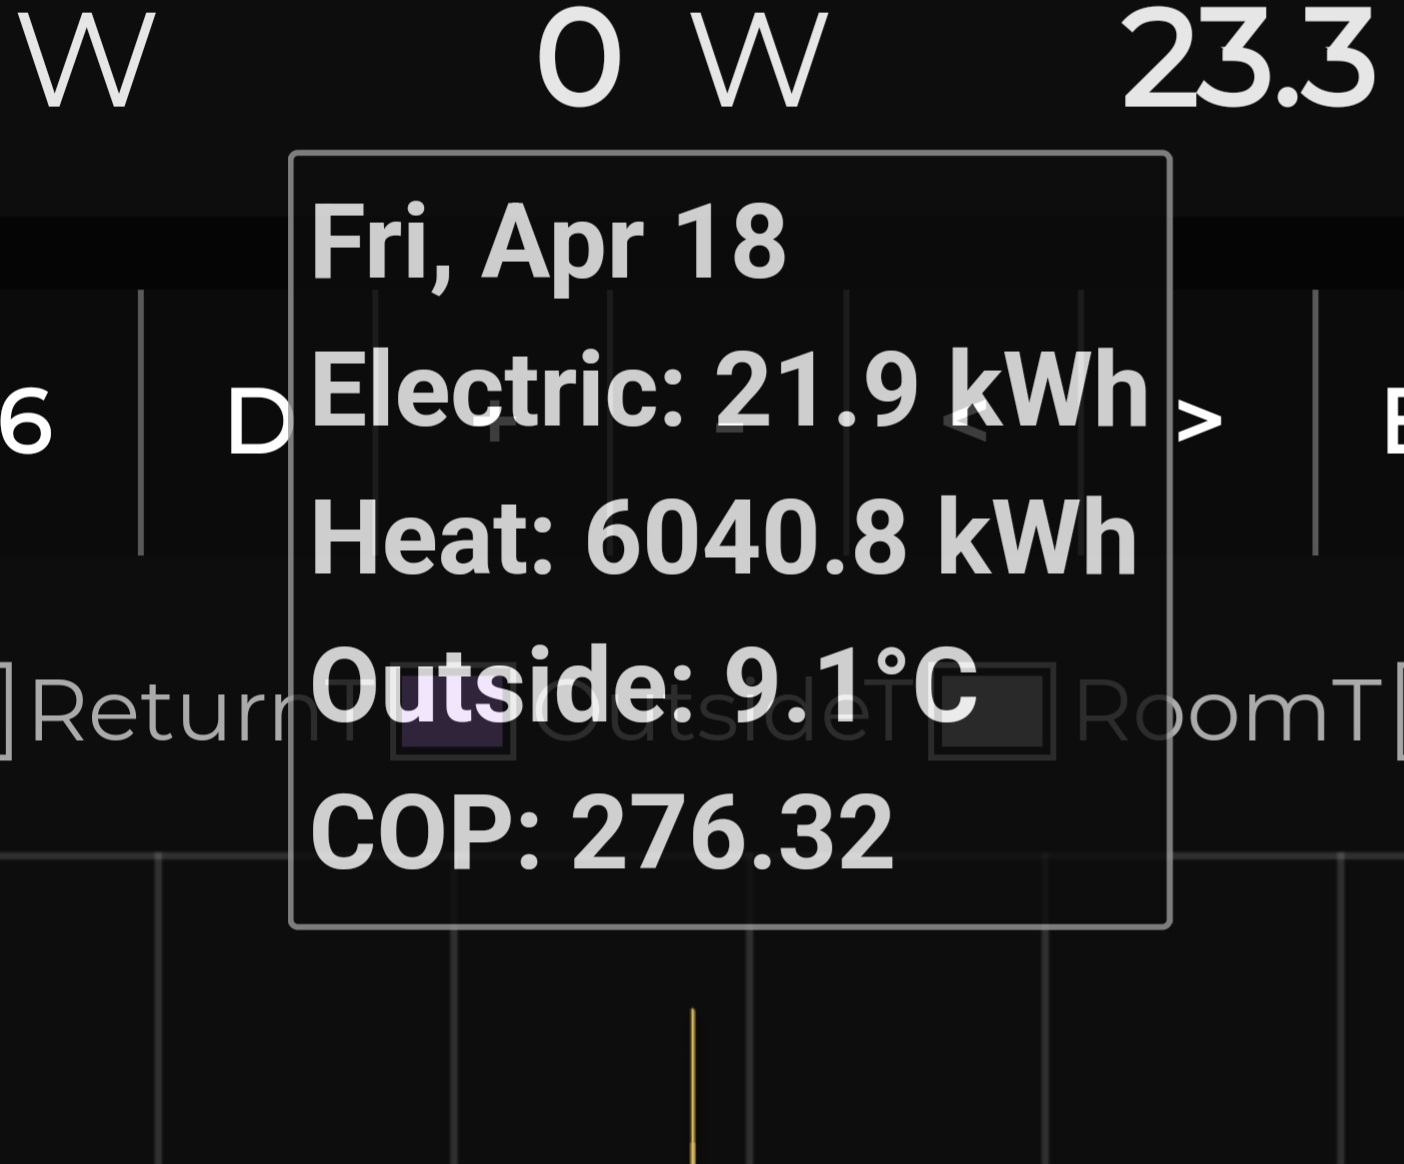
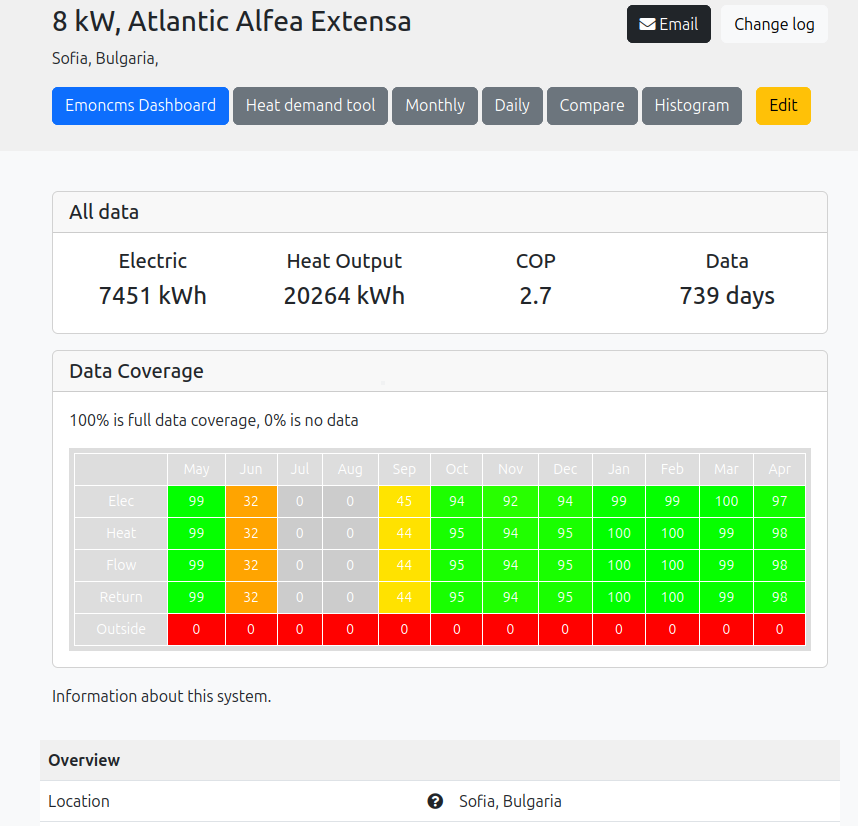
The top of the SCOP table is flawed. What’s the point in ranking systems when a lot of the individual SCOP figures are just plain wrong? Some of the heat pumps listed near the top should actually be much further down—only reason they’re up there is because of outlier days showing wildly inflated COPs, some over 300! I get that it can be taken as a bit of craic, but if we’re using this data to show clients what’s realistically achievable, it needs to be accurate.
It should also be clear whether the results include domestic hot water (DHW), or better yet, split the data to show space heating and DHW separately. Otherwise, it’s just muddying the waters.
Yes, I use a normal browser. (Can’t stand phones, especially for complex information.)
I don’t know how to get rid of the spurious systems. Hadn’t seen them before, but it only seems to be the top one or two systems so it’s easy to see that the figures are nonsense and to ignore them.
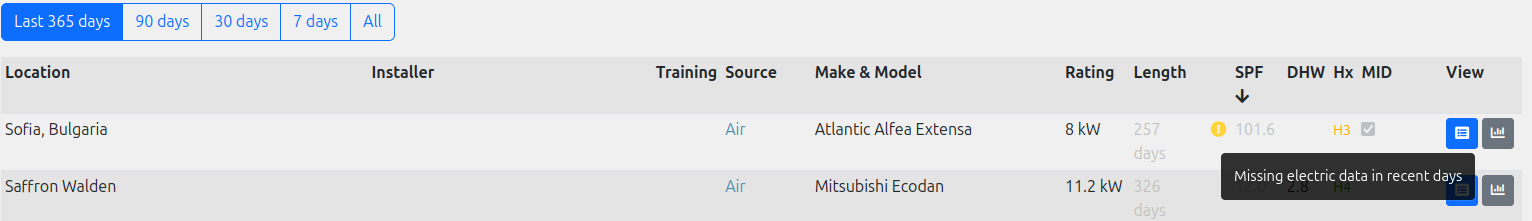
Please let us know if you see any other errors, as far as I can see the others at the top all look fine. If you can share the systemID that would be really helpful.
That a bit of an alarmist bold heading. There could be some very occasional erroneous readings, but I think, of all monitoring systems, Trystan & Glyn have gone to great lengths to get accuracy. They kept with class1 meters, as opposed to VFS etc. I was not aware of any of the top runners being there due to inaccuracy/erroneous readings.