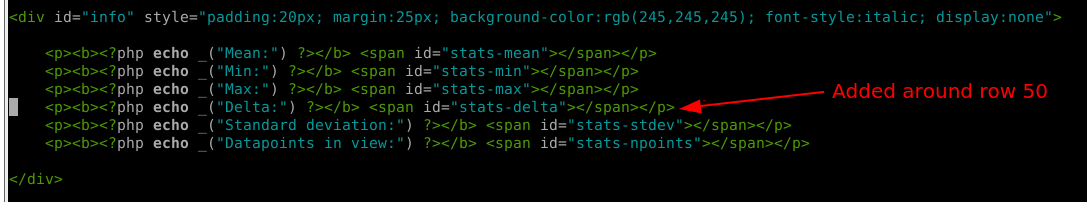
I made a tiny hack to the rawdata script, to display a delta between min and max readings, which I thought I’d share as it may be of use to others. Hopefully this is the right place for this? Please forgive me if it’s not!
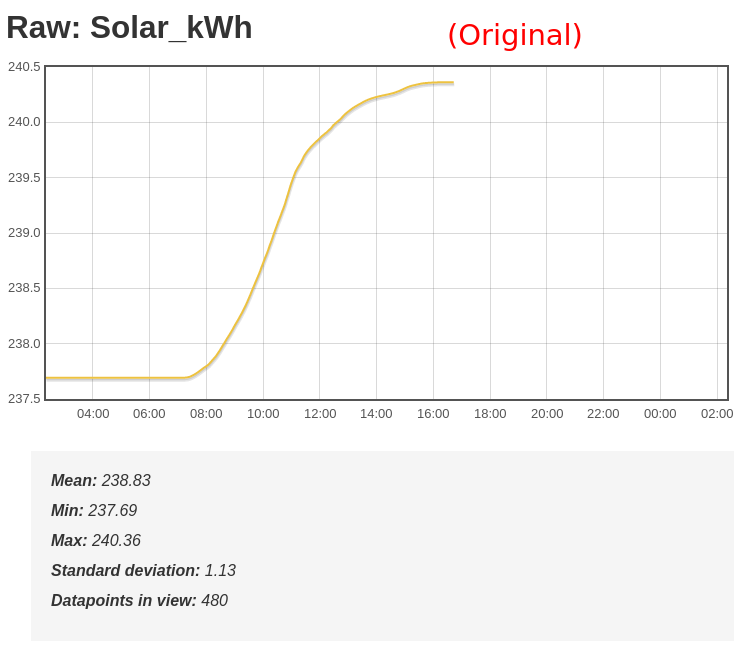
One of the things I sometimes like to know is how many kWh I’ve either drawn from grid, or produced, or fed into my immersion heater “so far today”. The bargraph vis script doesn’t display ‘the day so far’ as its final column, so what I’ve tended to do is fire up the ‘rawdata’ and then view the day from midnight onwards. This would then display below the graph, a value for Mean, Min, Max etc. But not the difference from min to max (i.e. how much produced so far today). I’ve added an extra line here that calculates the delta.
It only required a tiny modification to one script, and, at least for me, it saves me doing mental arithmetic each time!
Desktop and command line. I’m running Debian+Xfce. But I have various RPis, and have been using Linux (starting with Slackware 2.1 IIRC) since about 1996. I’m not really ops or sysadmin and deffo not a programmer, but I am a bodger. I’ve done a bit of ham radio stuff on Linux too.