Graphs not working on dashboard

Hi,
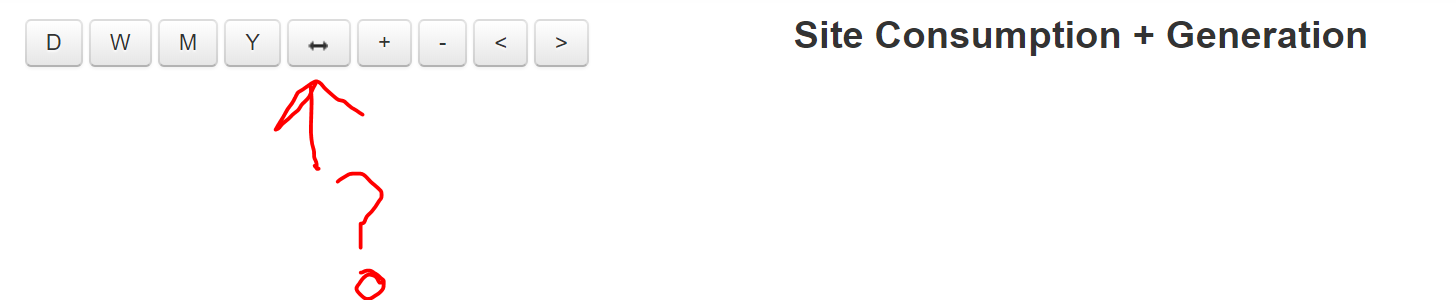
Has anyone else recently experienced dashboard graphs no longer working? Looks like the issue raised itself a couple of days ago. The graph no longer renders, but the time scale buttons do. There is also a new ‘double-arrow’ symbol where the timescale buttons are.

The graph renders correctly in the Setup->Graphs, but not on the dashboard.

Any ideas?

And this is the error chrome is giving:

Phill

Got the same problem.

graph does not render on dashboard, but I can see it in the Graph module…

Did a update to emoncms version: 9.8.30 | 2018.05.08

emoncms is running on a webserver installe on a synology NAS…

Best regards
Henrik

Testing here with latest emoncms master and stable branch and latest graph module master and stable, dashboard embedded graphs seem to work ok.

Did you update emoncms core, the dashboard module and the graph module?

I Can see graphs dials etc. On pc, some of the elements are missing on smart phone… happens after the update… on iPhone Firefox browser I am missing elements…

When using safari browser all is present…

http://79.174.152.130/wordpress/pool_data/

Henrik

It’s probably a browser caching problem.
Can you try again except use firefox ‘private window’, or chrome ‘incognito’ and see if that resolves it.

Paul

Clearing browser cache fixed the issue for me. Its a bit of hassle though, because i’ve had to do it on every pc and phone that has previously viewed the dashboard…

Yes, but more a browser shortcoming than a problem caused by emoncms :grinning:

Paul

Thank did solve the “problem”

Thank god. Thought the update did currupt my data…

Henrik