I am trying to graph multiple daily energy feeds on a single daily graph on a local raspberry pi based emoncms. The historical daily energy feeds are generated via input processing using the Power to kWh/d process. The Forecast solar energy feed data is generated from Solcast data using node red and loaded using the Feed API. :
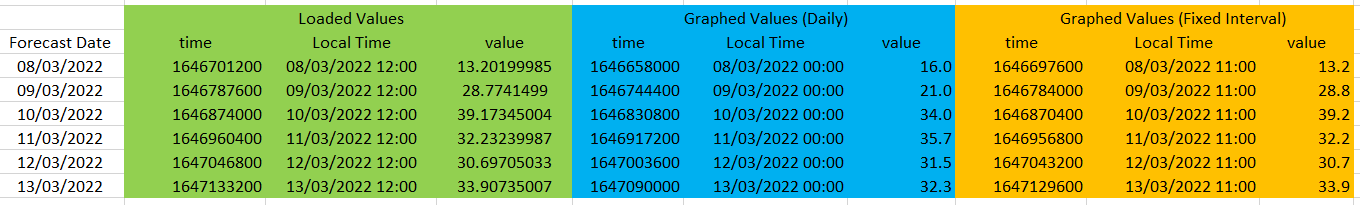
My difficulties are associated with the type of graph selected. If I select a Fixed Interval 86400sec graph type, the current day’s data is shown on the previous day. If I select a Daily graph type, the current day’s data is shown on the correct day however the future forecast data loaded as above is incorrect on the graph. The CSV outputs of the subject data for the two different graph types is shown below.
As there is only one data point for each day for the forecast, I can’t imagine how the Daily graphing function can generate a different value.
Can someone point me to an explanation of the Daily graphing function or help me get the correct values displayed on my Daily graph?
I think this is because the forecast_times are inserted at midday rather than at midnight, and EmonCMS is interpolating between days. If you shift the forecast_times to be aligned to midnight, that might help?
It did help Tim. Thank you. The graph is aligned now with the correct values shown.
The fixed interval graph on the other hand does not appear to interpolate.
So now I have a different but related problem with the same graph.
The graph in question is used as part of a dashboard. The graph is saved as a Daily type graph in emoncms.
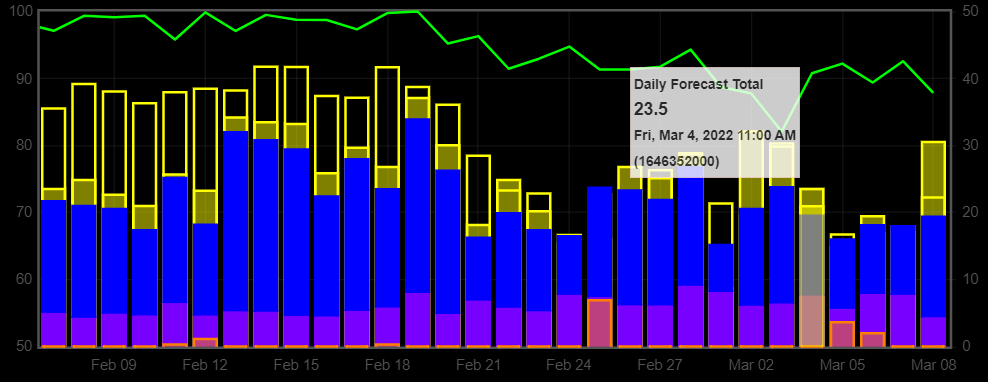
When the dashboard is displayed without logging in to emoncms, the interpolation that @Timbones identified above is evident in the displayed forecast (the non-shaded yellow bars) consistent with the associated data being aligned with midnight GMT (11:00 local time). This is very evident in the right most set of bars.
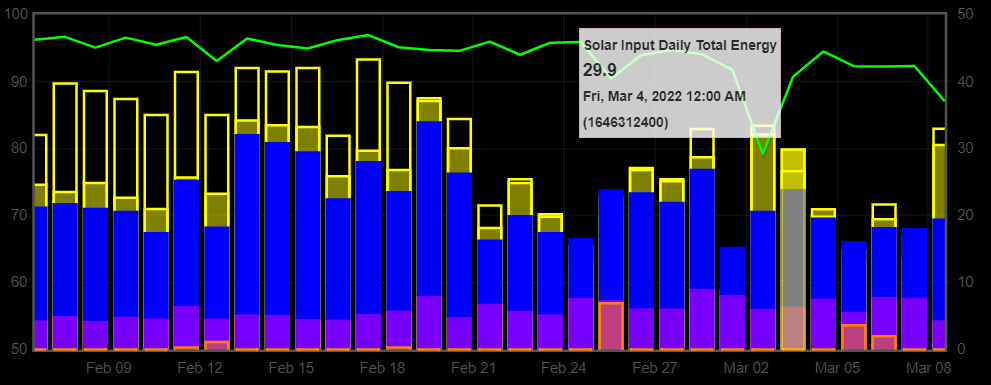
When the dashboard is displayed when logged in to emoncms, no interpolation is evident and the bars on the graph and the associated forecast data as expected.