I may be being useless, but I don’t see how to do that in Emoncms.
Of course I can build an app to do this and drive flot in whatever way I like, but I thought I’d ask here to see if I’m just missing something obvious.
After 2 years, I guess you weren’t missing anything that obvious…
How could we go about extending your MMSPHeatPump app or making a new app that plots number of cycles or efficiency against outdoor temperature and other interesting things for a given time range? That app is a great help for monitoring experiments but I find I’m copying numbers from it to spreadsheets if I want to analyse the results or plot graphs. I’m still a bit hazy on how emoncms apps work, despite knowing all the languages used.
It sounds as though you might want to do two different things.
One is to look at cycles per time range. Arguably, if you had a feed of “a cycle was started” then it could be accumulated by EmonCMS and you could graph it using the normal EmonCMS tools (or the MMSPHeatPump app).
Now, generating that feed might be difficult. For example, you need to make sure that a defrost or a few minutes offline don’t count as a cycle. In my naive implementation at the moment I’m looking at when OperationMode goes between zero and non-zero.
You may find that you can generate such a rule inside EmonCMS using the Feeds logic, but I haven’t chased that enough to know if it’s possible.
One nice thing about the charting in EmonCMS is that you can ask for a delta of the cumulative total which shows you when the value changed. I think that’s true, but I might be remembering that from some other system
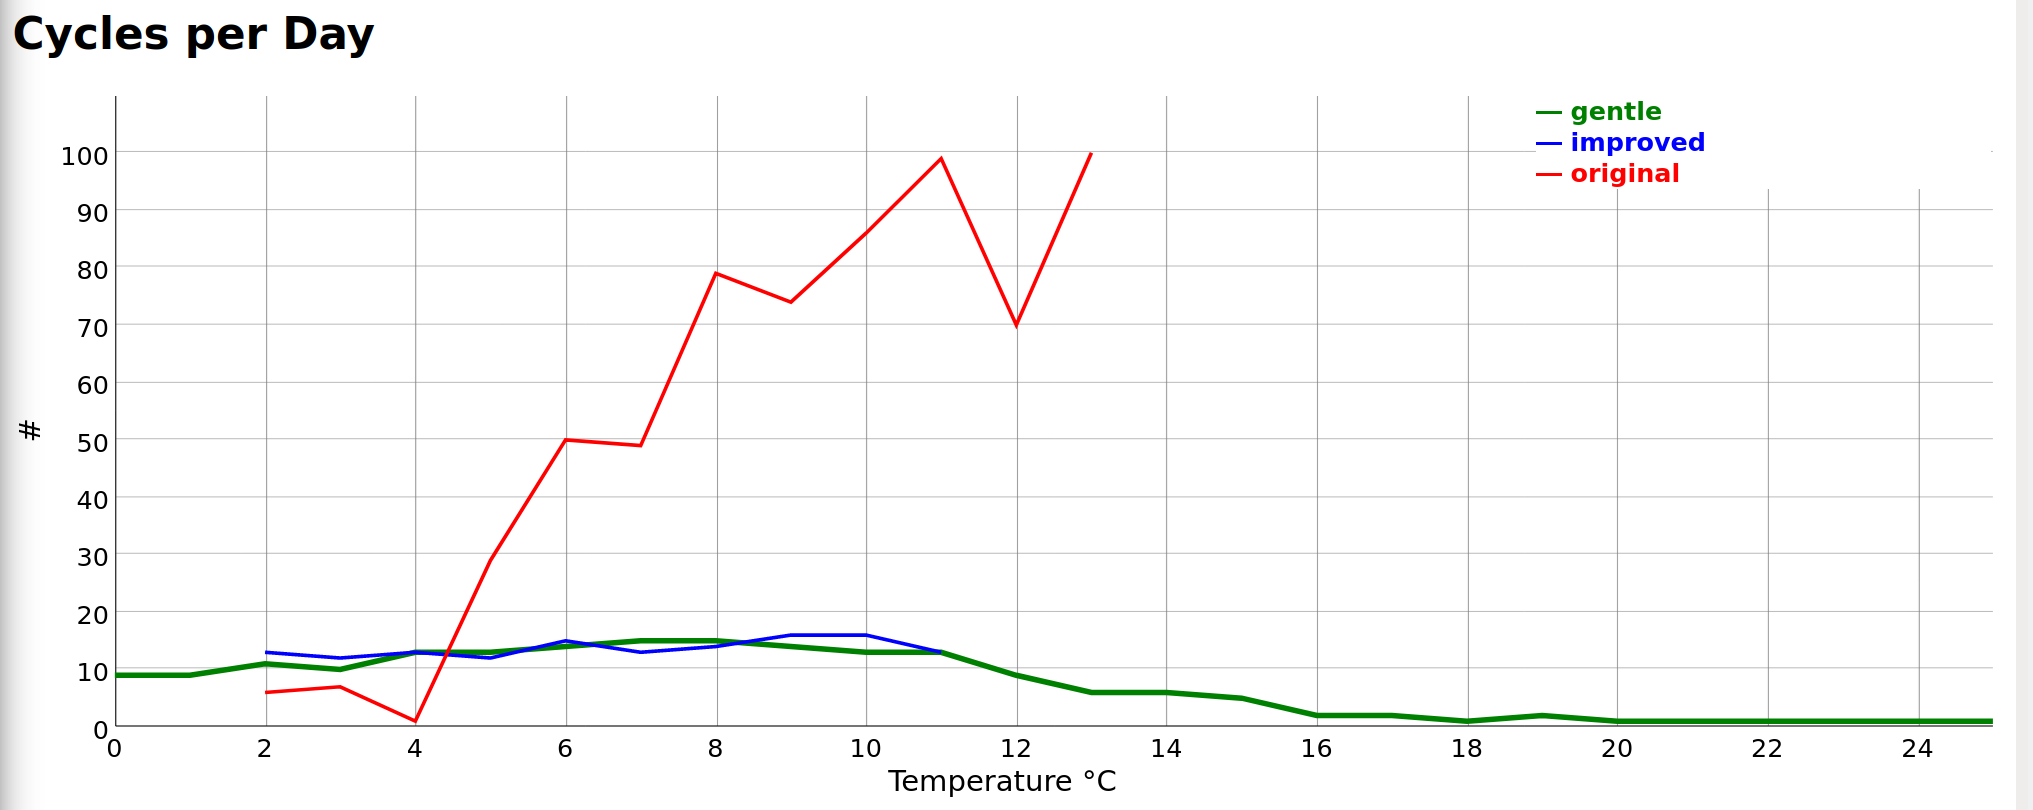
The other thing you might be trying to do is to chart against a non-time axis, such as outdoor temperature. I haven’t pushed ahead with doing that in EmonCMS because I’ve been pulled into my new job too much I’m afraid. I don’t think I’m going to get round to it any time soon.
As you may know, I cheated and used a Python script to do that which gives me charts like this:
Those take ages to produce because they look through a few million files working out the behaviours relative to the outdoor temperature, rather than time which a time-series store, such as PHPFina, would use. Notably I can only query the EmonCMS data by time not by another attribute such as outdoor temperature.
What makes this incredibly grisly is when you are merging data from multiple sources, such as the heat pump, power monitoring and weather station. They all use different time granularity and have different outages so you have to determine what you are going to use to interpolate values you might want to hand.
I was running a Jupiter-as-a-Service system for a while and started doing this analysis in there but I find simple Python scripts take less care-and-feeding which is what I need at the moment.
If you just want more time-based data in my app you can hack the PHP pretty easily. You can see I used data-config-keys to drive what’s actually in each chart so you can easily change those or add new charts. I think you mentioned you may have done something like that already.
<div data-config-keys="Space Heating CoP,Hot Water CoP,Nominal CoP@Design,Nominal CoP@Flow" class="chart"></div>
You’ll probably already have seen that application-configuration.json allows you to hack the way things are rendered too.
Could I suggest that you do your extracts from the EmonCMS API and then build the charts on those exports if you find you are copying-and-pasting a lot?
Yes, your understanding is quite right. I was wondering if something like your “cheated” scripts or my more manual process could be done in an app, but I’ve looked at a few more and they all seem pretty time-based.
I should look at PHPFina more closely to see what it can do. Most of my time series work was done in R. But like you, I am not overburdened with free time now.