Graph peculiarities with phptimeseries

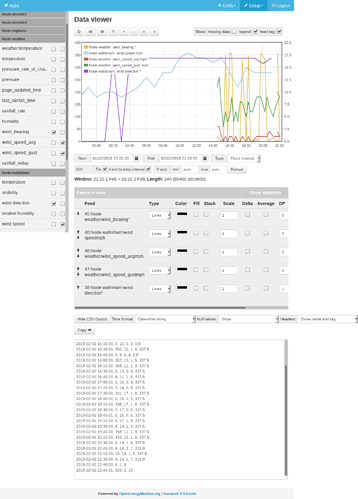
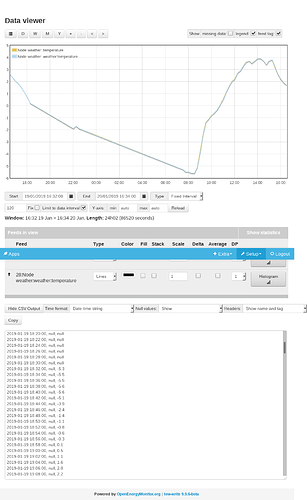
I’m integrating some local weather data into my emoncms system by uploading it using the input API. The website I’m scraping it from updates every five minutes on the hour; so I capture every fifteen minutes at one minute past the hour. I’ve created a phpfina log feed called weather:temperature and a phptimeseries log feed called just temperature. The node is called weather. I’ve noticed some odd effects when I graph the data:

There’s a bunch of nulls because I was still updating my screenscraper code and also because the website doesn’t update overnight - I suspect the weather station PC get turned off.

But what I don’t understand is why the data shown in the CSV list doesn’t match that shown in the graph? The graph shows both series one on top of the other, and the data in the feed files confirms that. But the CSV shows some large negative values for the phpfina series at a time when there ar nulls in the data. The phpfina data is:

2019-01-19 18:15:00 0.200000
2019-01-19 18:30:00 NaN NaN
2019-01-19 18:45:00 NaN NaN
2019-01-19 19:00:00 NaN NaN
2019-01-19 19:15:00 NaN NaN
2019-01-19 19:30:00 NaN NaN
2019-01-19 19:45:00 NaN NaN
2019-01-19 20:00:00 NaN NaN
2019-01-19 20:15:00 NaN NaN
2019-01-19 20:30:00 NaN NaN
2019-01-19 20:45:00 NaN NaN
2019-01-19 21:00:00 NaN NaN
2019-01-19 21:15:00 NaN NaN
2019-01-19 21:30:00 NaN NaN
2019-01-19 21:45:00 NaN NaN
2019-01-19 22:00:00 -1.900000
2019-01-19 22:15:00 -1.700000

The phpfina series just disappears from the CSV after 2019-01-19 19:46:00. In reality it is null but resumes at 22:00 as seen above.

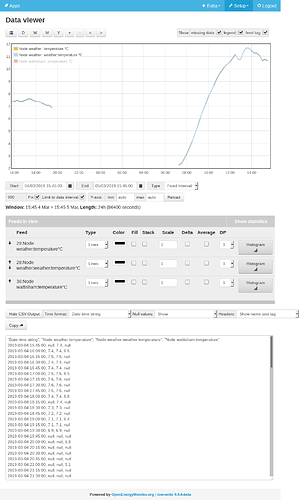
Another mystery is why the phptimeseries disappears entirely from the graph when I check the ‘missing data’ box.

PS sorry about the blue bar through the middle of the picture. An unexpected side-effect of FF screenshot and the site’s CSS.
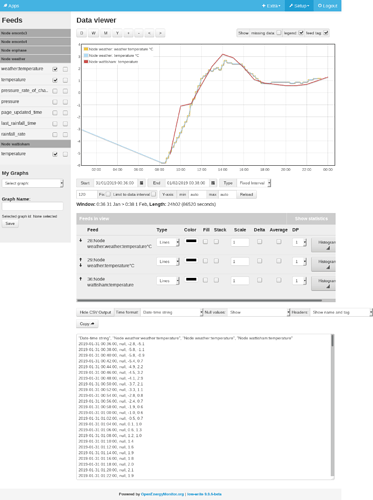
Here’s another example screenshot

Node 28 weather:weather:temperature is PHPFINA
Node 29 weather:temperature is PHPTIMESERIES
Node 36 wattisham:temperature is PHPTIMESERIES

28 and 29 are derived from the same input, which arrives every fifteen minutes. 36 arrives every hour.

The CSV is weird. The values in the screenshot for node 28 are correct. The feed is null after midnight because the source website stops updating overnight. The other two are wrong.

Node 29 should also be null at these times, because it’s derived from the same input, which isn’t updating. Looking at the value, you can see the first value the CSV actually contains is the last good value which occurred just before midnight. The next value (supposedly at 00:38) actually occurred at 08:15, and the values afterwards gradually increase to zero supposedly at 01:04 but actually at 11:30 as can be seen on the graph.

Node 36 is even more weird. All the supposed data reported in the CSV occur before the feed was even created! The first actual entry is at 09:00 as shown on the graph. The remaining hourly values for that feed are simply listed in the CSV as though they occurred at the two minute sampling interval that happens to have been used by the graph display.

As before, if I show missing data, both the blue and red lines disappear from the graph. The data points themselves are still on the graph and can be detected by hovering the mouse. The graph seems to be using a broken rule to determine whether or not there is missing data for PHPTIMESERIES. And for working out the CSV, of course.

Oh, as to why I’m using PHPTIMESERIES. Partly just for interest but both inputs have irregular data. The ‘weather’ data stops overnight as I’ve mentioned. The ‘wattisham’ data is every hour, but I have fourteen years of historical data for that station, and the early part of the history is at three-hourly intervals instead.

Another weirdness. Same feeds as before but looking at yesterday and using a 900 second data interval on the graph. Occasional data values for feed 29 are missing:

2019-02-01 15:15:00, 3.1, 3.1, null
2019-02-01 15:30:00, 3.1, 3.1, null
2019-02-01 15:45:00, 3.0, 3.0, null
2019-02-01 16:00:00, 2.9, 2.9, 2.5
2019-02-01 16:15:00, 2.8, 2.8, null
2019-02-01 16:30:00, 2.7, 2.7, null
2019-02-01 16:45:00, 2.7, null, null
2019-02-01 17:00:00, 2.6, 2.6, 2.1
2019-02-01 17:15:00, 2.5, 2.5, null
2019-02-01 17:30:00, 2.5, null, null
2019-02-01 17:45:00, 2.5, 2.5, null
2019-02-01 18:00:00, 2.6, 2.6, 1.9
2019-02-01 18:15:00, 2.6, 2.6, null
2019-02-01 18:30:00, 2.5, 2.5, null
2019-02-01 18:45:00, 2.4, 2.4, null
2019-02-01 19:00:00, 2.4, 2.4, 1.8
2019-02-01 19:15:00, 2.3, 2.3, null

The three data columns are feeds 28,29 and 36. Remember 28 and 29 are both logged from the same input so should be identical. But for some reason the graph module has lost a few points. I’ve checked and they are present in the file, so the data is recorded properly, but is not accessible reliably through the GUI.

And here’s another one - data occurring out of sequence! i.e. the graph turns back on itself and the CSV goes backwards in time.

Hello @djh, thanks for testing. I will setup some PHPTimeSeries test feeds to try and replicate what your seeing.

This will happen if the requested datapoint times are too far away from an actual PHPTimeSeries data points. It will just return null for that time value and the graph will be unable to link a line where nulls are present. You need at least 2 non null datapoints for the graph to draw a line. If you unckeck missing data the null values are not returned and so the graph is able to link the remaining valid values.

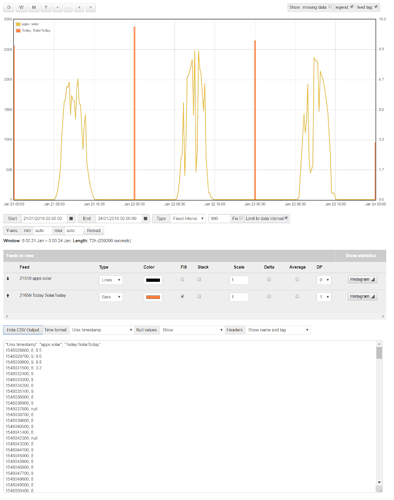
An easy way to reproduce the issue reported in the second post of this thread is to chart a phpfina and a kwh/d (daily) phptimeseries together then observe the CSV.

assuming a 10s phpfina interval, if you have (for eample) 4 days data on view there will be only 4 entries on the second column (as maybe expected) but they are using the first 4 timestamps of the phpfina data so it appears there is only 1 hour’s worth of data not 4 days. There appears to be no mapping of the timestamps.

(I’ve just captured this off emoncms.org so it isn’t the latest master branches)

thanks @pb66 will look into it

Thanks for the issue created on the graph module @djh graphs don't handle phptimeseries properly · Issue #55 · emoncms/graph · GitHub

Yes indeed. I think though that that algorithm is not correct for phptimeseries. Rather than consider that there should be values on the graph at regular intervals, it should accept that the only valid values are those that are already there, so there can never be missing data in a phptimeseries by definition. (Unless of course the deleted byte is set (never?) or the value itself is NaN (never?))

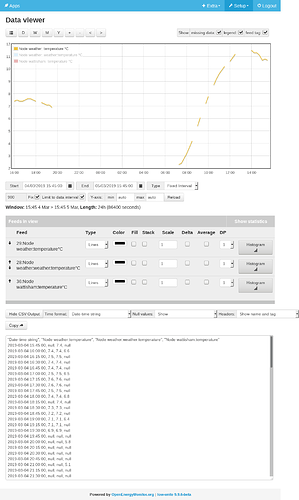
I’ve noticed another peculiarity associated with phptimeseries. Graph seems to be picking up nulls, even for times when there is data. See the two graphs below.


They both show the same data but I’ve hidden a PHPFINA feed of the same data in the second one to make the gaps in the PHPTIMESERIES more obvious.

Both feed 28 and feed 29 are logged from the same input. 28 is a PHPFINA whilst 29 is a PHPTIMESERIES. They both update every 15 minutes. If you look at the CSV it is apparent that the values for feed 29 at 15:45 and 18:15 are null, whilst feed 28 has values. In reality, both feeds have values at those times - I have checked the contents of the data files and they are the same. So the missing data points are some artefact of the graph module or whatever is feeding it data.

The missing data after 19:30 is real - the weather station did not supply any readings overnight. You can see more missing-data artefacts in the graph the following morning.