netrider
4 April 2019 17:15
1
Hello,
I already try to find this problem in the forum, but can’t find.
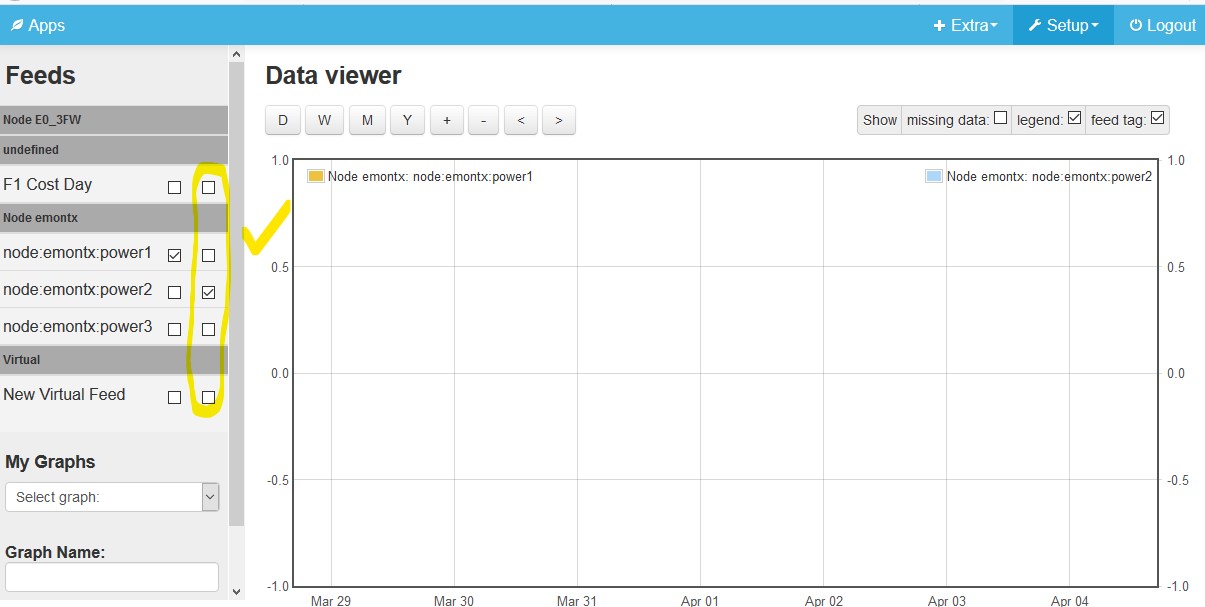
The problem is when I use some feeds in the graph interface, i don’t have available the second scale axis.
First: Request of data viewer graph
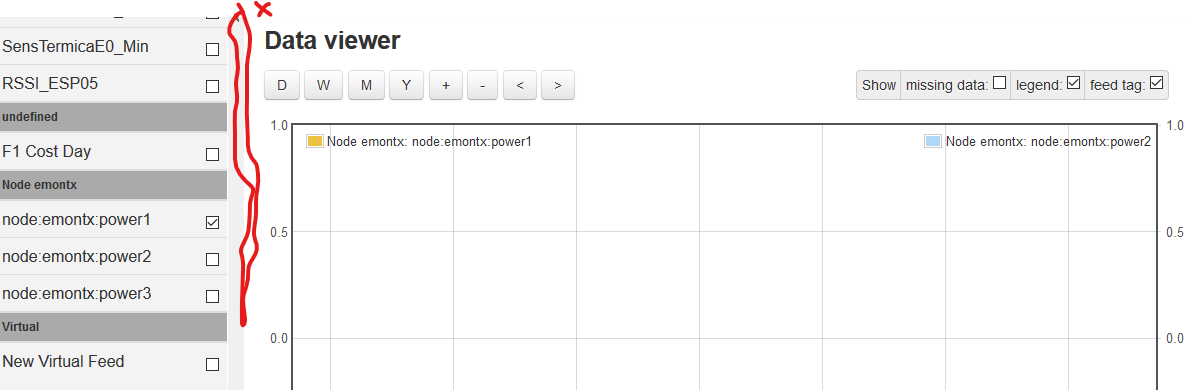
Second:Open feeds from another group, lost axis selection.
Can some one help ?
Thanks in advance.
djh
6 April 2019 15:05
2
I see that the width of those screenshots are different. Is that significant? Can you get both the good case and the bad case and show full browser-width screenshots including the top of the window in both cases? Have you done anything such as changing font sizes (CTRL-+)?
It may be a bug, but it’s difficult to know unless somebody else can reproduce your symptoms. I haven’t been able to so far based on the information you’ve provided.
edit: oh and what is your hardware & software configuration?
netrider
7 April 2019 09:21
3
Hello.
This is my Pi info:
Server Information
Services
emonhub
Active Running
emoncms_mqtt
Active Running
feedwriter
Active Running - sleep 60s
service-runner
Active Running
emonPiLCD
Active Exited
redis-server
Active Running
mosquitto
Active Running
Emoncms
Version
low-write 9.9.8
Modules
Administration : App v1.2.1 : Backup v1.1.6 : EmonHub Config v1.1.0 : Dashboard v1.3.3 : Device v1.2.1 : EventProcesses : Feed : Graph v1.2.3 : Input : Postprocess v1.0.0 : CoreProcess : Schedule : Network Setup v1.0.0 : sync : Time : User : Visualisation : WiFi v1.3.1
Git
URL: GitHub - emoncms/emoncms: Web-app for processing, logging and visualising energy, temperature and other environmental data : Branch: * stable : Describe: v9.5.1-1775-gd0db7a57
Server
OS
Linux 4.14.71-v7+
Host
emonpi : emonpi : (192.168.2.90)
Date
2019-04-07 09:16:43 UTC
Uptime
09:16:43 up 1 day, 22:06, 0 users, load average: 0.11, 0.13, 0.14
HTTP
Server
Apache/2.4.25 (Raspbian) HTTP/1.1 CGI/1.1 80
MySQL
Version
5.5.5-10.1.23-MariaDB-9+deb9u1
Host
127.0.0.1 (127.0.0.1)
Date
2019-04-07 09:16:42 (UTC 00:00)
Stats
Uptime: 165988 Threads: 2 Questions: 200884 Slow queries: 0 Opens: 31 Flush tables: 1 Open tables: 25 Queries per second avg: 1.210
Redis
Version
3.2.6
Host
localhost:6379 (127.0.0.1)
Size
Uptime
1 days
MQTT Server
Version
Mosquitto 1.4.10
Host
localhost:1883 (127.0.0.1)
Pi
Model
Raspberry Pi 3 Model B Rev 1.2 - 1 GB (Sony UK)
SoC
Broadcom BCM2835
Serial num.
C1F1512A
Temperature
CPU: 30.56°C - GPU: 30.6’C
Release
emonSD-30Oct18
Memory
RAM
Used: 29.18% Total: 976.74 MB Used: 285.02 MB Free: 691.71 MB
Swap
Used: 0.00% Total: 100 MB Used: 0 B Free: 100 MB
Disk
Mount
Stats
/
Used: 40.06% Total: 3.81 GB Used: 1.53 GB Free: 2.11 GB
/boot
Used: 51.69% Total: 42.52 MB Used: 21.98 MB Free: 20.54 MB
/home/pi/data
Used: 0.48% Total: 24.52 GB Used: 121.52 MB Free: 23.15 GB
PHP
Version
7.0.30-0+deb9u1 (Zend Version 3.0.0)
Modules
apache2handler : calendar v7.0.30-0+deb9u1 : Core v7.0.30-0+deb9u1 : ctype v7.0.30-0+deb9u1 : curl v7.0.30-0+deb9u1 : date v7.0.30-0+deb9u1 : dom v20031129 : exif v7.0.30-0+deb9u1 : fileinfo v1.0.5 : filter v7.0.30-0+deb9u1 : ftp v7.0.30-0+deb9u1 : gd v7.0.30-0+deb9u1 : gettext v7.0.30-0+deb9u1 : hash v1.0 : iconv v7.0.30-0+deb9u1 : igbinary v2.0.1 : json v1.4.0 : libxml v7.0.30-0+deb9u1 : mbstring v7.0.30-0+deb9u1 : mcrypt v7.0.30-0+deb9u1 : mosquitto v0.4.0 : mysqli v7.0.30-0+deb9u1 : mysqlnd vmysqlnd 5.0.12-dev - 20150407 - $Id: b5c5906d452ec590732a93b051f3827e02749b83 $ : openssl v7.0.30-0+deb9u1 : pcre v7.0.30-0+deb9u1 : PDO v7.0.30-0+deb9u1 : pdo_mysql v7.0.30-0+deb9u1 : Phar v2.0.2 : posix v7.0.30-0+deb9u1 : readline v7.0.30-0+deb9u1 : redis v4.1.1 : Reflection v7.0.30-0+deb9u1 : session v7.0.30-0+deb9u1 : shmop v7.0.30-0+deb9u1 : SimpleXML v7.0.30-0+deb9u1 : sockets v7.0.30-0+deb9u1 : SPL v7.0.30-0+deb9u1 : standard v7.0.30-0+deb9u1 : sysvmsg v7.0.30-0+deb9u1 : sysvsem v7.0.30-0+deb9u1 : sysvshm v7.0.30-0+deb9u1 : tokenizer v7.0.30-0+deb9u1 : wddx v7.0.30-0+deb9u1 : xml v7.0.30-0+deb9u1 : xmlreader v7.0.30-0+deb9u1 : xmlwriter v7.0.30-0+deb9u1 : xsl v7.0.30-0+deb9u1 : Zend OPcache v7.0.30-0+deb9u1 : zlib v7.0.30-0+deb9u1
Client Information
HTTP
Browser
Mozilla/5.0 (Windows NT 10.0; Win64; x64; rv:66.0) Gecko/20100101 Firefox/66.0
Screen
Resolution
1366 x 768
Window
Size
1349 x 654
No the scale in the browser is the same, and making zoom in / out, it’s the same.
In fact, I try to reproduce the problem in other Pi (only my 3 first inputs/feeds) but can’t have the same problem.
Maybe is because this is a feed group with 96 feeds ?
I the others more simple feed groups don’t have any problem.
djh
7 April 2019 11:35
4
Thanks for the server and client information. I only have linux here so I suppose this may be a problem that only occurs on a browser in Windows? Do you have a linux system or an apple product that you could bring a browser up on to see if you get the same problem?
The problem may be associated with the number of feeds, indeed. Can you post pictures of the entire browser window, so we can see the context?
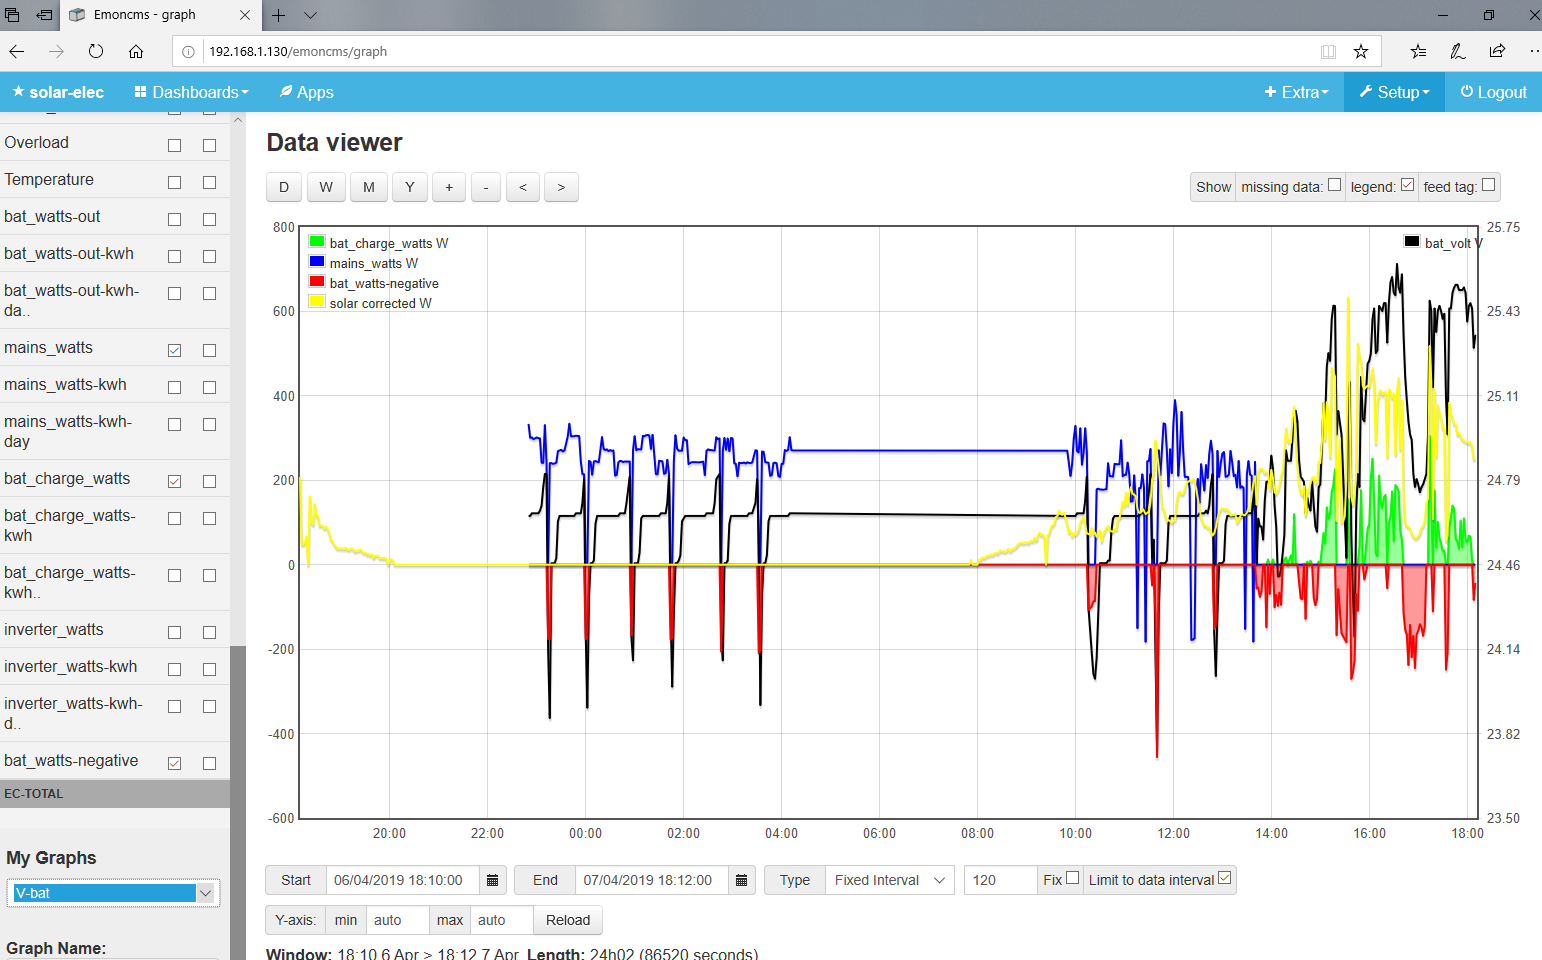
I also note that when I use two axes, the entire legend appears on the left-hand side of the graph, whereas your legend is split between the two sides. Is that a facility in emoncms I’m just not aware of? See an example below.
Why is there no data shown in your graphs?
netrider
7 April 2019 12:30
5
Hello djh.
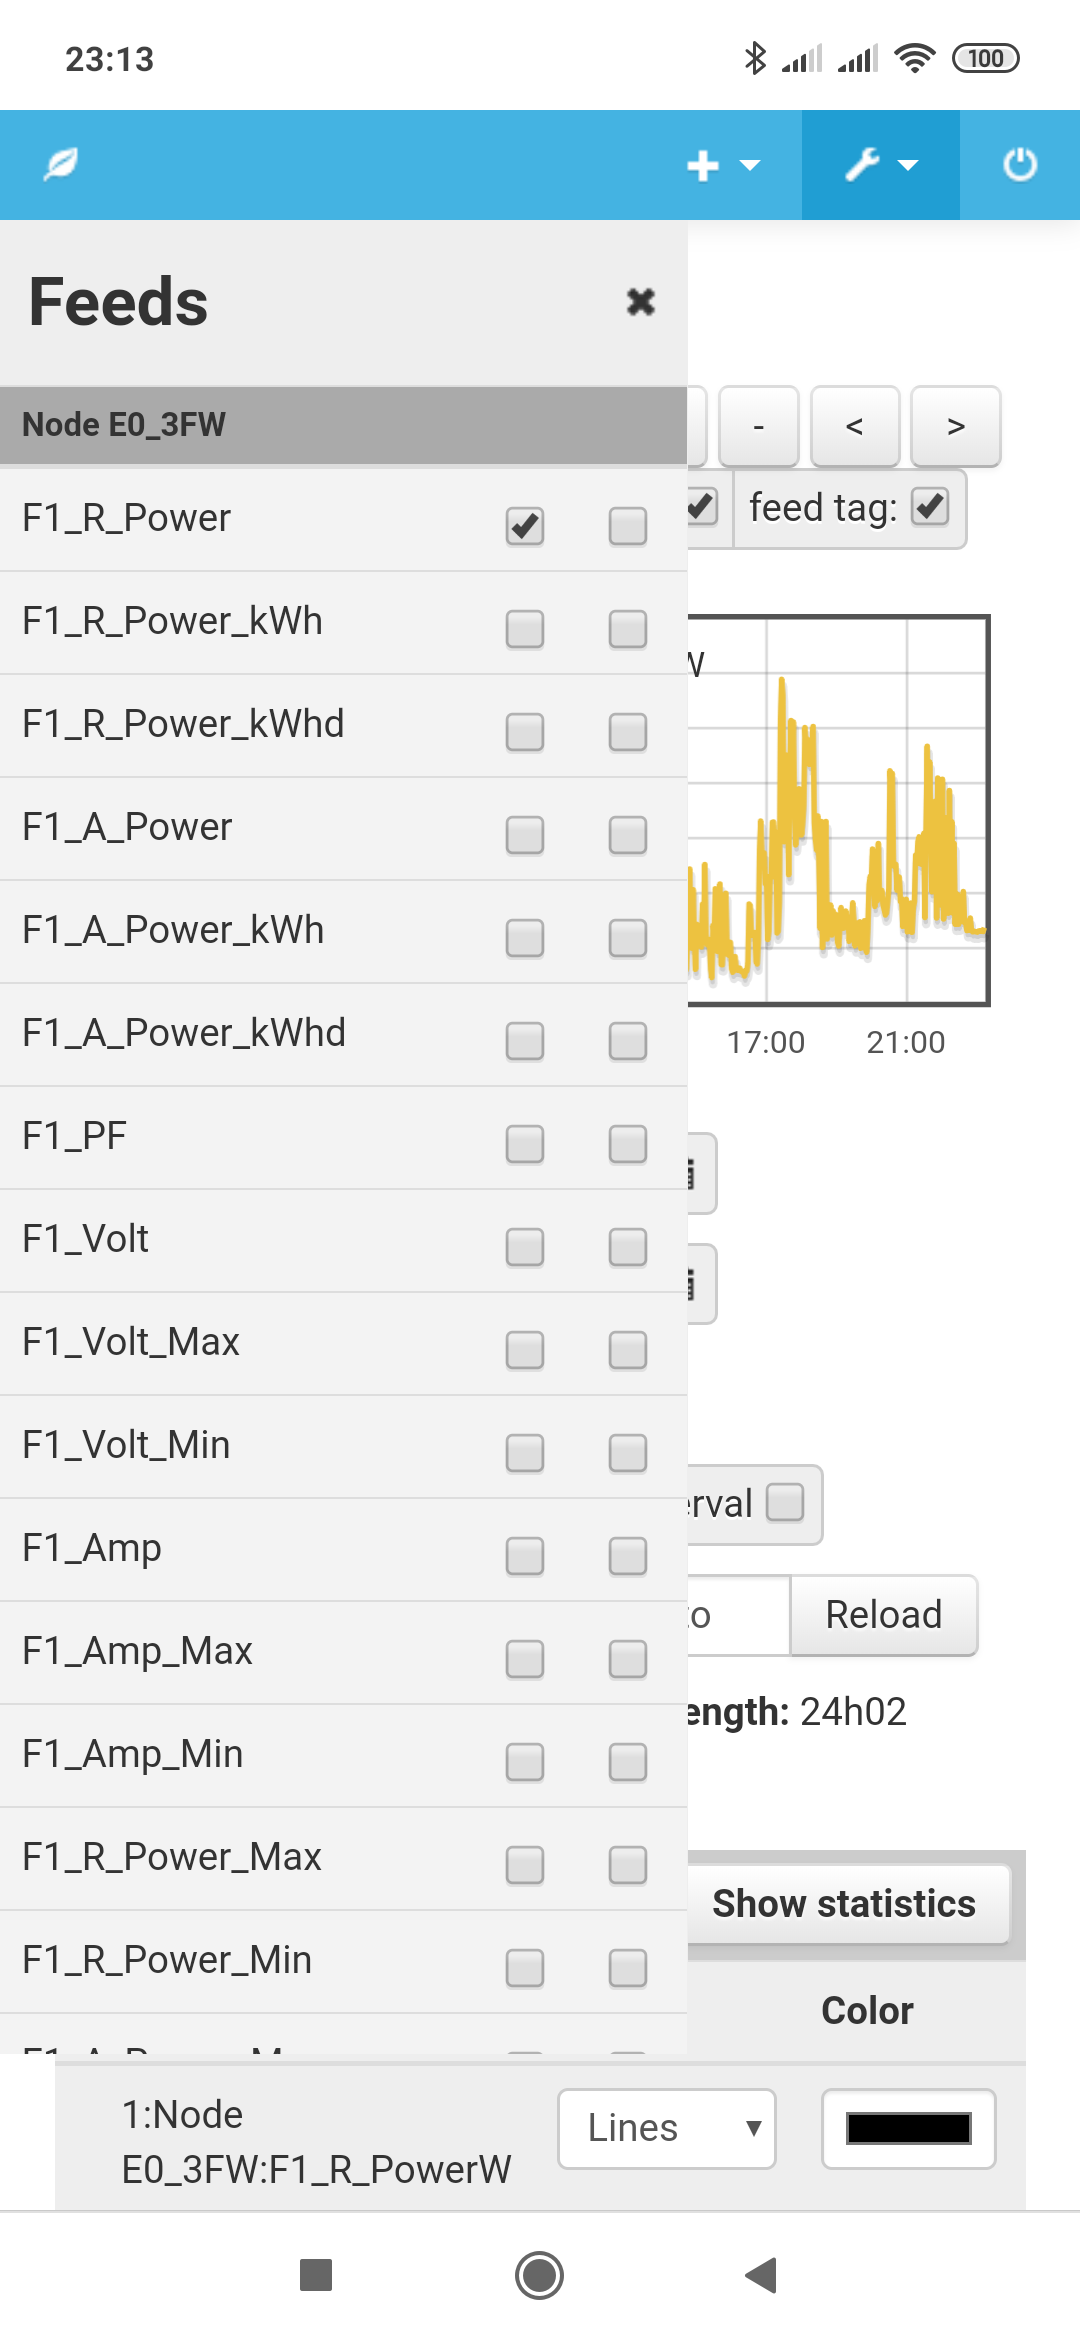
Maybe in fact is an Windows problem. I check with my android phone (chrome) and the two axis are showed.
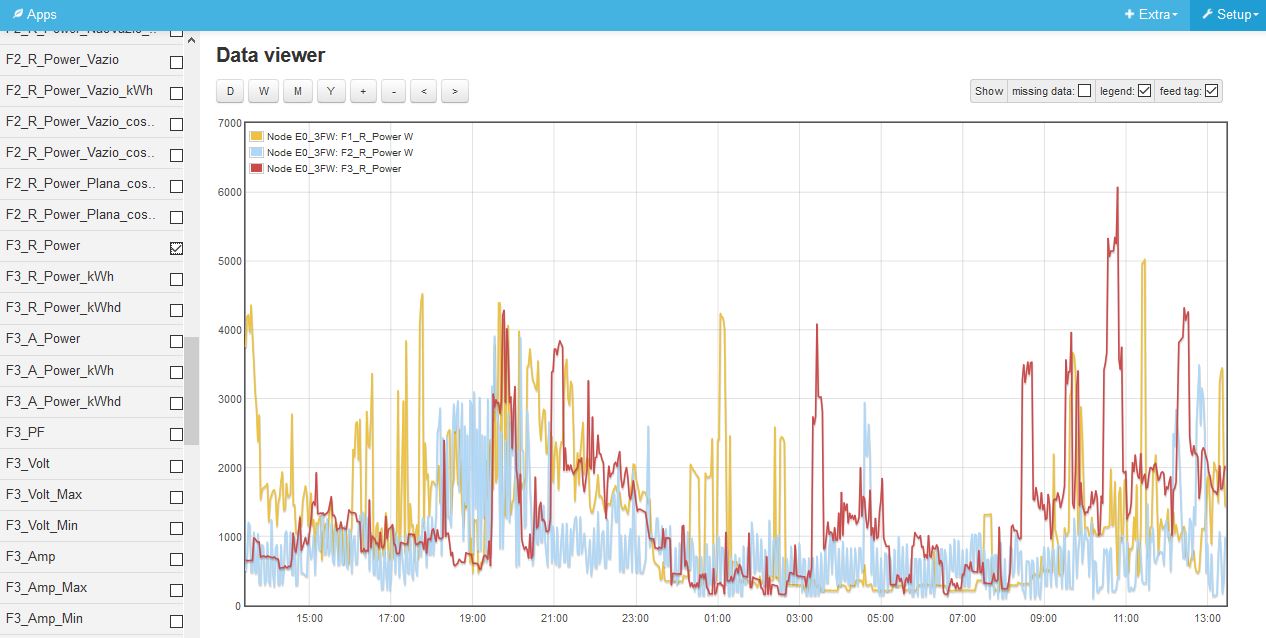
This is my feeds list of E0_3FW group:
Node E0_3FW 5MB 2s
Exist data on my graphs.I only test and select something.
Thanks
djh
7 April 2019 15:40
6
Thanks. It does look like it may be a problem on Windows systems with a lot of feeds. I don’t know if anybody else is reading this thread that has such a system and can confirm these symptoms?
fired up a win10 via virtualisation on my mac, except if I squeeze the window to a very small screen (not sure you can do this nuts on a real PC) then the sidebar just disappears
netrider
7 April 2019 17:35
8
Hello.
I verify the same problem in Ubuntu/Firefox browser. Same as Windows. Strange because in Android work well!
djh
7 April 2019 18:58
9
It’s not nuts. I run most of my windows narrow enough ( < 1023 pixels) that the sidebar hides itself.
But you may not be able to reproduce it because you don’t have enough feeds. The OP has 96. I don’t know how many you have.
djh
7 April 2019 19:02
10
Ah, that’s good news. In the sense that it seems to be something specific to a large number of feeds. Maybe @TrystanLea or whoever could try to reproduce it and then they’d stand a chance of understanding and fixing it.
It might be worth @netrider creating a bug report at this point, so the issue is properly tracked.
101 in total. Could also be the fact I run W10 via parallels, things never react the same depending on how it is run.
netrider
7 April 2019 22:18
12
If this is a bug, it’s strange.
Regards
I have also seen this happening, resulting from long feed names. We are working on a sidebar UI update and will review this as part of that work. BETA: New Emoncms V10 UI *Feedback Request*