Neil
17 May 2019 12:33
1
Hello,
I inadvertently upgraded to version 10.0.0 (I didn’t know this version had been released as stable ) while trying to solve issues with the post-process module and the various missing menu items. It’s not a problem for me that I’m using v10.0.0 even if its still a little ‘buggy’.
However, I noticed that the graph ID is missing from the Graphs setup page. (I’m embedding the graphs in node-RED ) but am unable to embed more as I need to know the graph ID.
Also, in the existing graphs I embedded in node-RED the graph buttons have stopped working
I also checked EmonCMS dashboards and the graph buttons have stopped working there also.
I’m also experiencing some other issues which I’ll document later after investigating, but the question arises should I revert to v9.9.9? and is that possible?
Any ideas?
Thanks
borpin
18 May 2019 21:34
2
What do you mean by the graph buttons (DWM etc?)? Have you cleared your browser cache?
Neil
19 May 2019 10:24
3
Hello Brian,
The graph buttons are:
They work correctly in the Graph module when creating new graphs and viewing existing graphs. They are inoperable when viewing a graph in EmonCMS dashboard or embedded in Node RED.
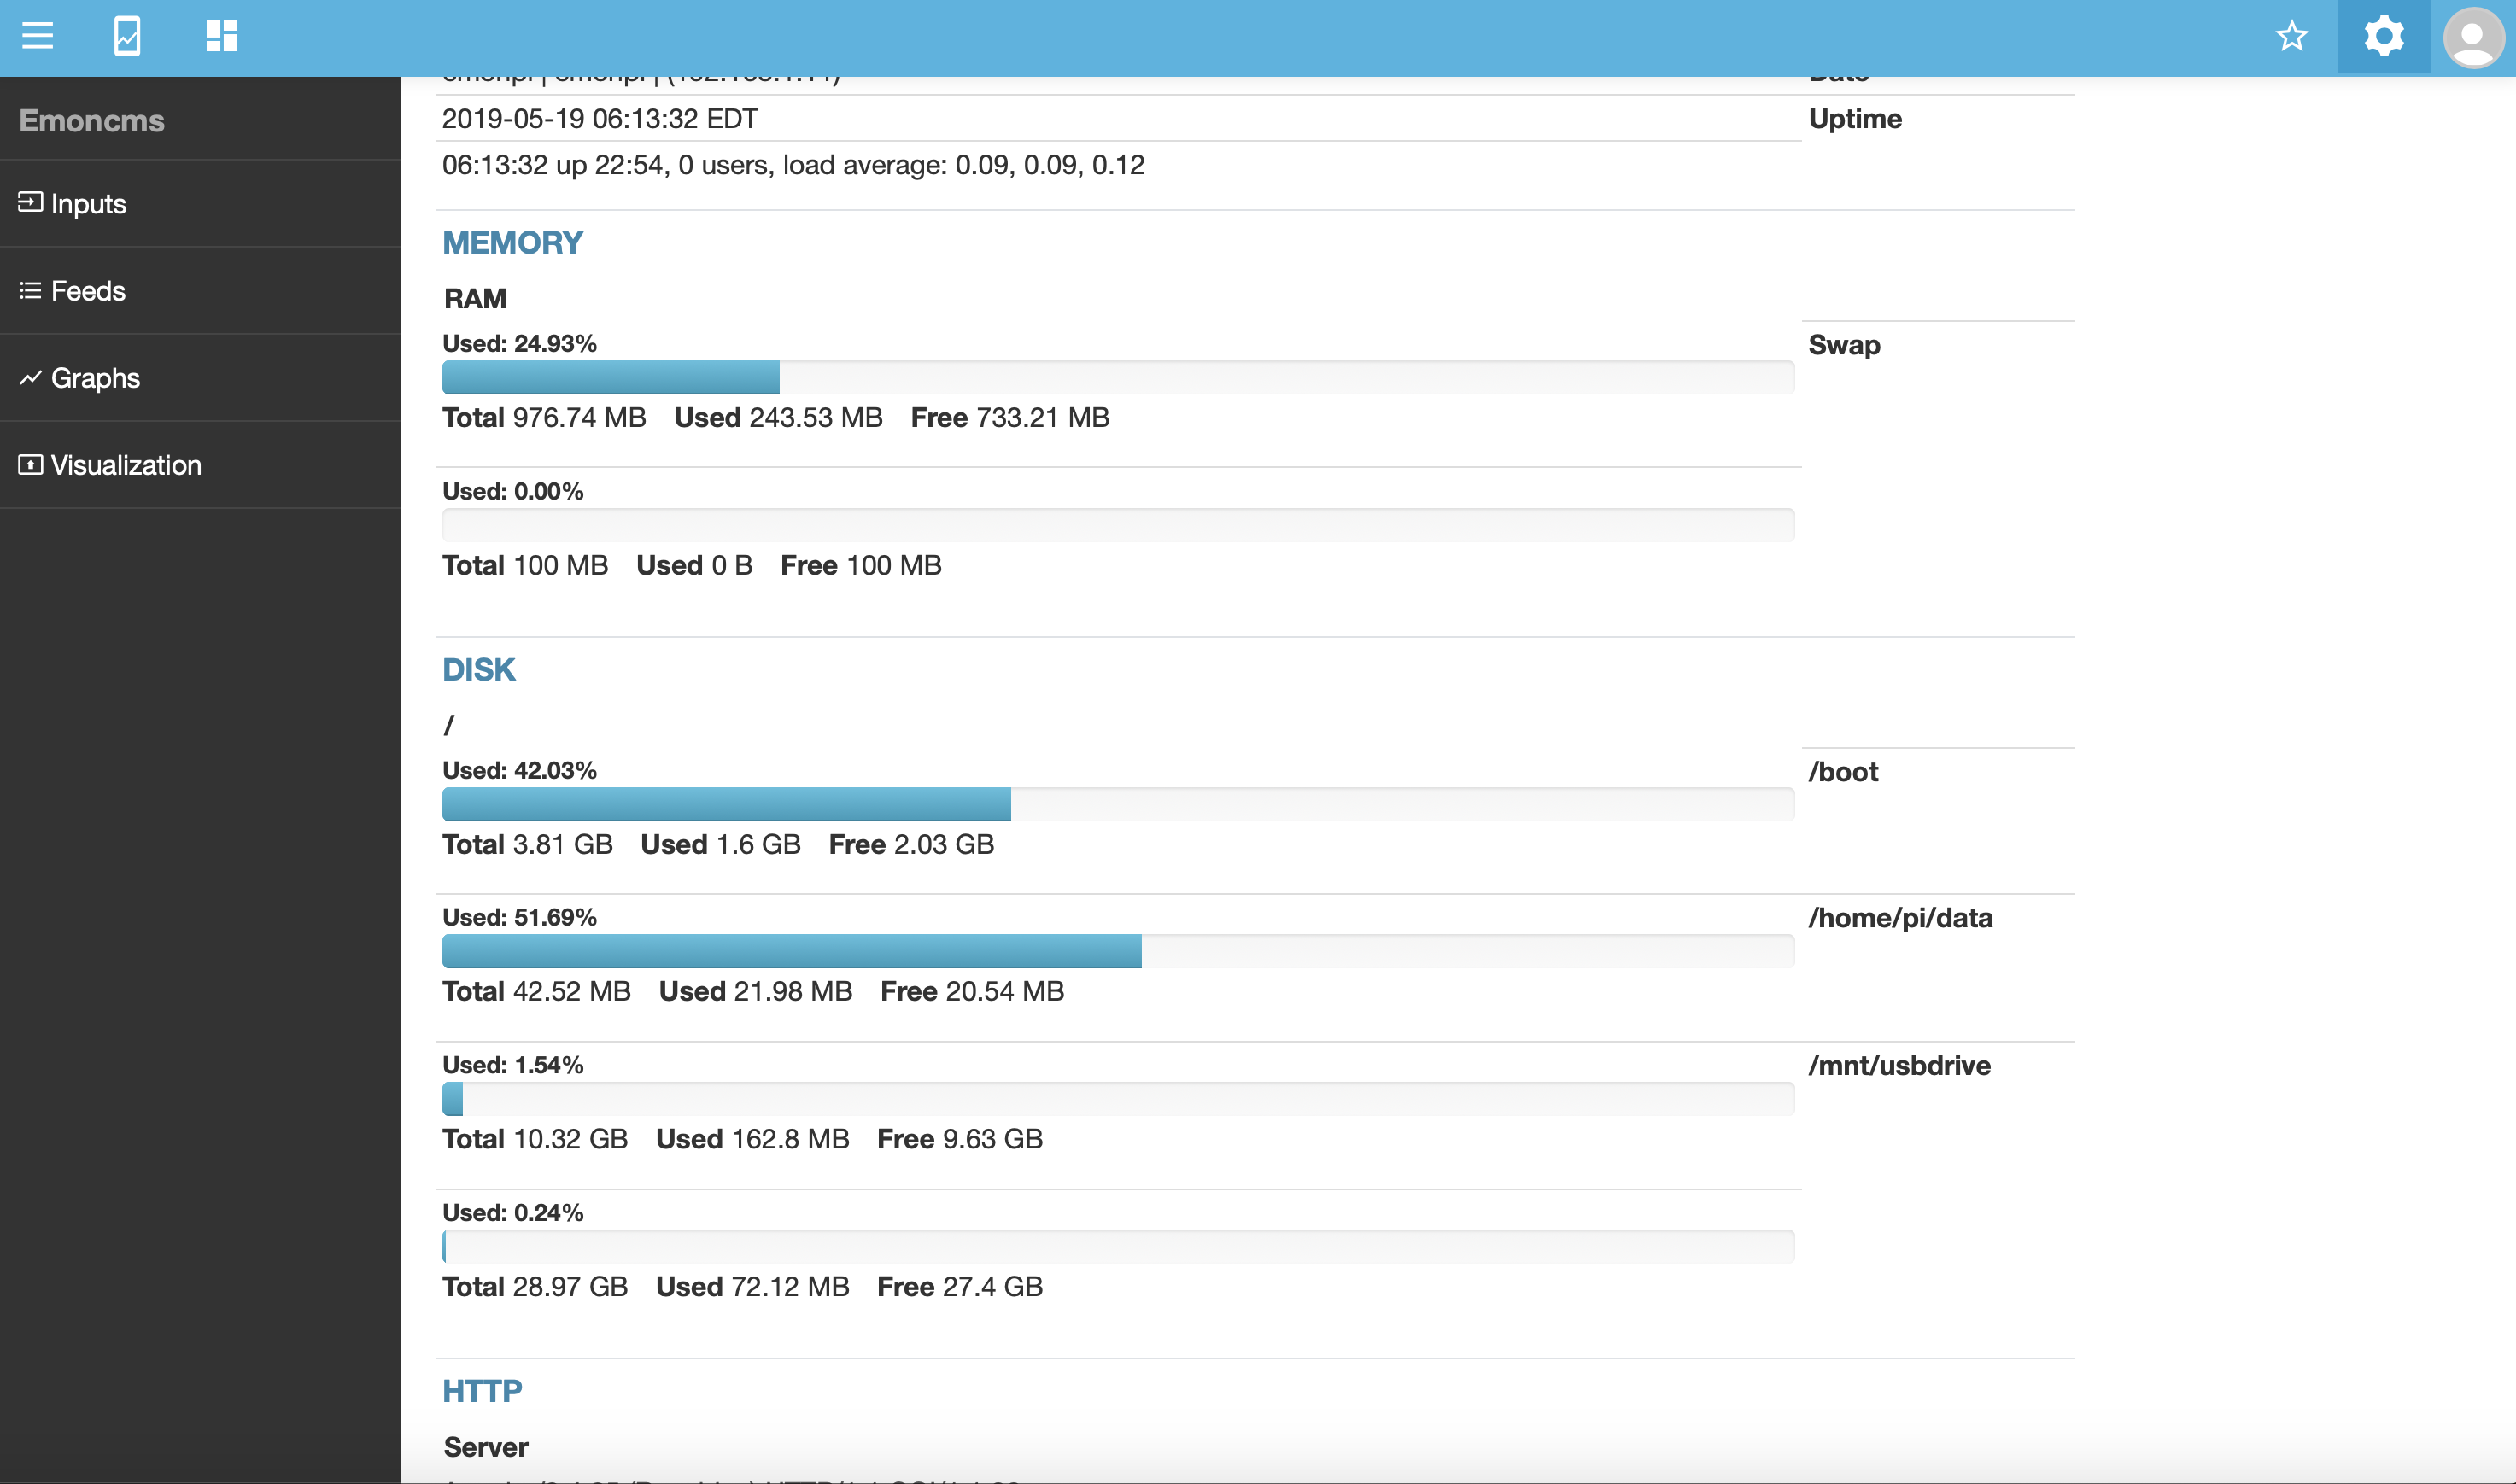
The are several formatting errors in Admin view, /var/log also seems to be missing (I believe this visible before). Also this view is not filling up it’s real estate, too narrow fill screen.
The biggest issue for me is not being able to know the graph ID number. Is there another way to determine the graph ID number?
Server Information
emonhub :- Active Runningemoncms_mqtt :- Active Runningfeedwriter :- Active Running - sleep 60s 68 feed points pending writeservice-runner :- Active RunningemonPiLCD :- Active Runningredis-server :- Active Runningmosquitto :- Active Running
Version :- low-write 10.0.1Modules :- Administration | App v2.0.0 | Backup v1.1.6 | EmonHub Config v2.0.0 | Dashboard v2.0.1 | Device v2.0.0 | EventProcesses | Feed | Graph v2.0.0 | Input | Postprocess v2.0.0 | CoreProcess | remoteaccess | Schedule | Network Setup v1.0.0 | sync | Time | User | Visualisation | WiFi v2.0.0Git :-
OS :- Linux 4.14.71-v7+Host :- emonpi | emonpi | (192.168.1.11)Date :- 2019-05-19 06:13:32 EDTUptime :- 06:13:32 up 22:54, 0 users, load average: 0.09, 0.09, 0.12
RAM :- Used: 24.93%
Total :- 976.74 MBUsed :- 243.53 MBFree :- 733.21 MB
Swap :- Used: 0.00%
Total :- 100 MBUsed :- 0 BFree :- 100 MB
/ :- Used: 42.03%
Total :- 3.81 GBUsed :- 1.6 GBFree :- 2.03 GB
/boot :- Used: 51.69%
Total :- 42.52 MBUsed :- 21.98 MBFree :- 20.54 MB
/home/pi/data :- Used: 1.54%
Total :- 10.32 GBUsed :- 162.8 MBFree :- 9.63 GB
/mnt/usbdrive :- Used: 0.24%
Total :- 28.97 GBUsed :- 72.12 MBFree :- 27.4 GB
Server :- Apache/2.4.25 (Raspbian) HTTP/1.1 CGI/1.1 80
Version :- 5.5.5-10.1.23-MariaDB-9+deb9u1Host :- localhost:6379 (127.0.0.1)Date :- 2019-05-19 06:13:31 (UTC -04:00)Stats :- Uptime: 82464 Threads: 3 Questions: 311499 Slow queries: 0 Opens: 50 Flush tables: 1 Open tables: 44 Queries per second avg: 3.777
Version :- 3.2.6Host :- localhost:6379Size :- 184 keys (791.95K)Uptime :- 0 days
Version :- Mosquitto 1.4.10Host :- localhost:1883 (127.0.0.1)
Version :- 7.0.30-0+deb9u1 (Zend Version 3.0.0)Modules :- apache2handler | calendar v7.0.30-0+deb9u1 | Core v7.0.30-0+deb9u1 | ctype v7.0.30-0+deb9u1 | curl v7.0.30-0+deb9u1 | date v7.0.30-0+deb9u1 | dom v20031129 | exif v7.0.30-0+deb9u1 | fileinfo v1.0.5 | filter v7.0.30-0+deb9u1 | ftp v7.0.30-0+deb9u1 | gd v7.0.30-0+deb9u1 | gettext v7.0.30-0+deb9u1 | hash v1.0 | iconv v7.0.30-0+deb9u1 | igbinary v2.0.1 | json v1.4.0 | libxml v7.0.30-0+deb9u1 | mbstring v7.0.30-0+deb9u1 | mcrypt v7.0.30-0+deb9u1 | mosquitto v0.4.0 | mysqli v7.0.30-0+deb9u1 | mysqlnd vmysqlnd 5.0.12-dev - 20150407 - Id: b5c5906d452ec590732a93b051f3827e02749b83 | openssl v7.0.30-0+deb9u1 | pcre v7.0.30-0+deb9u1 | PDO v7.0.30-0+deb9u1 | pdo_mysql v7.0.30-0+deb9u1 | Phar v2.0.2 | posix v7.0.30-0+deb9u1 | readline v7.0.30-0+deb9u1 | redis v4.1.1 | Reflection v7.0.30-0+deb9u1 | session v7.0.30-0+deb9u1 | shmop v7.0.30-0+deb9u1 | SimpleXML v7.0.30-0+deb9u1 | sockets v7.0.30-0+deb9u1 | SPL v7.0.30-0+deb9u1 | standard v7.0.30-0+deb9u1 | sysvmsg v7.0.30-0+deb9u1 | sysvsem v7.0.30-0+deb9u1 | sysvshm v7.0.30-0+deb9u1 | tokenizer v7.0.30-0+deb9u1 | wddx v7.0.30-0+deb9u1 | xml v7.0.30-0+deb9u1 | xmlreader v7.0.30-0+deb9u1 | xmlwriter v7.0.30-0+deb9u1 | xsl v7.0.30-0+deb9u1 | Zend OPcache v7.0.30-0+deb9u1 | zlib v7.0.30-0+deb9u1
Model :- Raspberry Pi 3 Model B+ Rev 1.3 - 1 GB (Sony UK)SoC :- Broadcom BCM2835Serial num. :- 5ABE4EF9Temperature :- 47.24°C - 47.2°CemonpiRelease :- emonSD-30Oct18File-system :- read-write
Client Information
Browser :- Mozilla/5.0 (Macintosh; Intel Mac OS X 10_14_4) AppleWebKit/605.1.15 (KHTML, like Gecko) Version/12.1 Safari/605.1.15Language :- en-us
Resolution :- 1680 x 1050
borpin
19 May 2019 14:11
4
Hi yes, I can replicate the issue here. I suggest that you raise the 2 things (buttons and ID) as separate issues Issues · emoncms/graph · GitHub and hopefully @glyn.hudson or @emrys will pick it up.
borpin
20 May 2019 10:35
6
@emrys , did you note the other issue re the Graph ID not being available?
emrys
20 May 2019 10:42
7
@borpin I wasn’t too sure where to add the Graph ID ?.. where should it be available?
borpin
20 May 2019 13:02
8
@emrys I think the thing is that it is never shown so it is not possible to know what the ID is. Under the graph selection boxes it says ‘graph ID not available’. I am guess ing it should be shown here what the ID of the selected graph is.
emrys
20 May 2019 13:18
9
I’m not seeing a “graph section” in the admin/view page on my laptop? I’ll test it on a raspberry pi tomorrow…
this is what is listed on my admin page (no graphs section):
Server Information
emonhub :- Active Runningmqtt_input :- Inactive Deadredis-server :- Active Runningmosquitto :- Active Running
Version :- 10.0.2-betaModules :- Administration | App v2.0.0 | Backup v2.0.0 | EmonHub Config v2.0.0 | Dashboard v2.0.1 | DemandShaper v1.0.0 | Device v2.0.0 | EventProcesses | Feed | Find v1.0.0 | Graph v2.0.0 | Group v2.0.0 | Input | CoreProcess | RemoteAccess v1.0.0 | Schedule | sync | Time | User | Visualisation | WiFi v2.0.0Git :-
URL :- [email protected] Branch :- masterDescribe :- 10.0.0-10-gf12522c0
OS :- Linux 4.15.0-47-genericHost :- emrys-xps-15-9530 | emrys-XPS-15-9530 | (127.0.0.1)Date :- 2019-05-20 14:14:10 BSTUptime :- 14:14:10 up 4 days, 4:24, 1 user, load average: 1.49, 1.47, 1.46
RAM :- Used: 57.48%
Total :- 7.7 GBUsed :- 4.42 GBFree :- 3.27 GB
Swap :- Used: 25.34%
Total :- 8 GBUsed :- 2.03 GBFree :- 5.97 GB
/ :- Used: 9.23%
Total :- 468.45 GBUsed :- 43.24 GBFree :- 401.35 GB
Server :- Apache/2.4.29 (Ubuntu) HTTP/1.1 CGI/1.1 80
Version :- 5.7.26-0ubuntu0.18.04.1Host :- localhost:6379 (127.0.0.1)Date :- 2019-05-20 14:14:10 (UTC 01:00)Stats :- Uptime: 361486 Threads: 1 Questions: 110349 Slow queries: 0 Opens: 452 Flush tables: 1 Open tables: 445 Queries per second avg: 0.305
Version :- 4.0.9Host :- localhost:6379Size :- 90 keys (842.99K)Uptime :- 4 days
Version :- Mosquitto 1.4.15Host :- localhost:1883 (127.0.0.1)
Version :- 7.2.17-0ubuntu0.18.04.1 (Zend Version 3.2.0)Modules :- apache2handler | calendar v7.2.17-0ubuntu0.18.04.1 | Core v7.2.17-0ubuntu0.18.04.1 | ctype v7.2.17-0ubuntu0.18.04.1 | curl v7.2.17-0ubuntu0.18.04.1 | date v7.2.17-0ubuntu0.18.04.1 | dom v20031129 | exif v7.2.17-0ubuntu0.18.04.1 | fileinfo v1.0.5 | filter v7.2.17-0ubuntu0.18.04.1 | ftp v7.2.17-0ubuntu0.18.04.1 | gettext v7.2.17-0ubuntu0.18.04.1 | hash v1.0 | iconv v7.2.17-0ubuntu0.18.04.1 | json v1.6.0 | libxml v7.2.17-0ubuntu0.18.04.1 | mbstring v7.2.17-0ubuntu0.18.04.1 | mosquitto v0.4.0 | mysqli v7.2.17-0ubuntu0.18.04.1 | mysqlnd vmysqlnd 5.0.12-dev - 20150407 - Id: 3591daad22de08524295e1bd073aceeff11e6579 | openssl v7.2.17-0ubuntu0.18.04.1 | pcre v7.2.17-0ubuntu0.18.04.1 | PDO v7.2.17-0ubuntu0.18.04.1 | pdo_mysql v7.2.17-0ubuntu0.18.04.1 | pdo_sqlite v7.2.17-0ubuntu0.18.04.1 | Phar v2.0.2 | posix v7.2.17-0ubuntu0.18.04.1 | readline v7.2.17-0ubuntu0.18.04.1 | redis v4.0.2 | Reflection v7.2.17-0ubuntu0.18.04.1 | session v7.2.17-0ubuntu0.18.04.1 | shmop v7.2.17-0ubuntu0.18.04.1 | SimpleXML v7.2.17-0ubuntu0.18.04.1 | sockets v7.2.17-0ubuntu0.18.04.1 | sodium v7.2.17-0ubuntu0.18.04.1 | SPL v7.2.17-0ubuntu0.18.04.1 | sqlite3 v7.2.17-0ubuntu0.18.04.1 | standard v7.2.17-0ubuntu0.18.04.1 | sysvmsg v7.2.17-0ubuntu0.18.04.1 | sysvsem v7.2.17-0ubuntu0.18.04.1 | sysvshm v7.2.17-0ubuntu0.18.04.1 | tokenizer v7.2.17-0ubuntu0.18.04.1 | wddx v7.2.17-0ubuntu0.18.04.1 | xml v7.2.17-0ubuntu0.18.04.1 | xmlreader v7.2.17-0ubuntu0.18.04.1 | xmlwriter v7.2.17-0ubuntu0.18.04.1 | xsl v7.2.17-0ubuntu0.18.04.1 | Zend OPcache v7.2.17-0ubuntu0.18.04.1 | zip v1.15.4 | zlib v7.2.17-0ubuntu0.18.04.1
Client Information
Browser :- Mozilla/5.0 (X11; Ubuntu; Linux x86_64; rv:66.0) Gecko/20100101 Firefox/66.0Language :- cy,en-GB;q=0.8,en;q=0.5,es;q=0.3
Neil
20 May 2019 14:19
10
Hi,
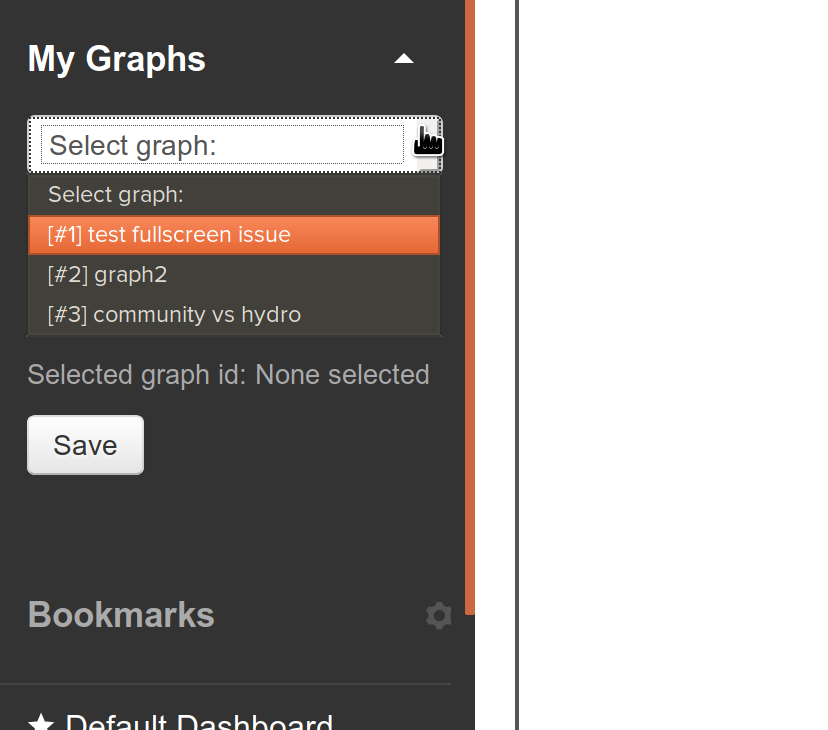
The graph ID used to be displayed where it currently says 'Selected graph id: None selected"
emrys
20 May 2019 17:56
11
thanks @Neil - i’ve created an issue on github regarding this
opened 05:55PM - 20 May 19 UTC
closed 12:14AM - 21 May 19 UTC

emrys
20 May 2019 19:20
13
I’ve added the graph id next to the dropdown names in the above pull request
when a graph is selected the “Selected graph id” box is changed to show the currently selected graph id:
thanks @neil and @borpin for the help
Thanks guys, PR’s have been merged into master
emoncms:master ← emrysr:feature/issue-88-show-graph-id
opened 07:13PM - 20 May 19 UTC
fix #88
showing selected graph id
removed unwanted console.log()

opened 05:55PM - 20 May 19 UTC
closed 12:14AM - 21 May 19 UTC

emoncms:master ← emrysr:fix/issue-86-embed-graph-buttons
opened 10:17PM - 19 May 19 UTC
the navigation buttons now work as expected on embedded graphs
Please confirm the issues have been fixed
borpin
21 May 2019 06:49
15
@Neil , if you want to test, you will need to switch to the master branch? You OK with that?
Neil
21 May 2019 11:02
16
My system is not critical (yet) so I’ll probably be OK with switching, but I don’t know how to switch to master. Please let me know how (if not too involved) and I’ll test.
Thanks Brian and Emrys, what a great and fast response.
Neil
borpin
21 May 2019 11:41
17
SSH into your system
cd /var/www/emoncms/
git pull
git checkout master
git pull
On testing this I found I needed the second git pull (to my surprise - need to investigate).
As and when these changes get pushed to the stable branch, you can do the same but with
git checkout stable
HTH
Neil
21 May 2019 13:22
18
I did this:
cd /var/www/emoncms/
git pull
git checkout master
git pull
EmonCMS version number changed from 10.0.1 (Stable) to 10.0.2 (beta).
I tested the graph buttons in an EmonCMS dashboard and in a node-RED embedded graph. I found the same behavior - buttons not working.
I checked for the graph ID in the graph module and that is still not visible (…same as before).
I rebooted and tested again but remains as described above.
Forgive me for leading a sheltered life, but what does HTH mean?
Server Information
emonhub :- Active Runningemoncms_mqtt :- Active Runningfeedwriter :- Active Running - sleep 60s 64 feed points pending writeservice-runner :- Active RunningemonPiLCD :- Active Runningredis-server :- Active Runningmosquitto :- Active Running
Version :- low-write 10.0.2-betaModules :- Administration | App v2.0.0 | Backup v1.1.6 | EmonHub Config v2.0.0 | Dashboard v2.0.1 | Device v2.0.0 | EventProcesses | Feed | Graph v2.0.0 | Input | Postprocess v2.0.0 | CoreProcess | remoteaccess | Schedule | Network Setup v1.0.0 | sync | Time | User | Visualisation | WiFi v2.0.0Git :-
OS :- Linux 4.14.71-v7+Host :- emonpi | emonpi | (192.168.1.11)Date :- 2019-05-21 09:14:34 EDTUptime :- 09:14:34 up 10 min, 1 user, load average: 0.21, 0.19, 0.13
RAM :- Used: 23.77%
Total :- 976.74 MBUsed :- 232.18 MBFree :- 744.56 MB
Swap :- Used: 0.00%
Total :- 100 MBUsed :- 0 BFree :- 100 MB
/ :- Used: 42.08%
Total :- 3.81 GBUsed :- 1.61 GBFree :- 2.03 GB
/boot :- Used: 51.69%
Total :- 42.52 MBUsed :- 21.98 MBFree :- 20.54 MB
/home/pi/data :- Used: 1.51%
Total :- 10.32 GBUsed :- 159.17 MBFree :- 9.64 GB
/mnt/usbdrive :- Used: 0.25%
Total :- 28.97 GBUsed :- 72.96 MBFree :- 27.4 GB
Server :- Apache/2.4.25 (Raspbian) HTTP/1.1 CGI/1.1 80
Version :- 5.5.5-10.1.23-MariaDB-9+deb9u1Host :- localhost:6379 (127.0.0.1)Date :- 2019-05-21 09:14:34 (UTC -04:00)Stats :- Uptime: 612 Threads: 4 Questions: 976 Slow queries: 0 Opens: 31 Flush tables: 1 Open tables: 25 Queries per second avg: 1.594
Version :- 3.2.6Host :- localhost:6379Size :- 177 keys (789.66K)Uptime :- 0 days
Version :- Mosquitto 1.4.10Host :- localhost:1883 (127.0.0.1)
Version :- 7.0.30-0+deb9u1 (Zend Version 3.0.0)Modules :- apache2handler | calendar v7.0.30-0+deb9u1 | Core v7.0.30-0+deb9u1 | ctype v7.0.30-0+deb9u1 | curl v7.0.30-0+deb9u1 | date v7.0.30-0+deb9u1 | dom v20031129 | exif v7.0.30-0+deb9u1 | fileinfo v1.0.5 | filter v7.0.30-0+deb9u1 | ftp v7.0.30-0+deb9u1 | gd v7.0.30-0+deb9u1 | gettext v7.0.30-0+deb9u1 | hash v1.0 | iconv v7.0.30-0+deb9u1 | igbinary v2.0.1 | json v1.4.0 | libxml v7.0.30-0+deb9u1 | mbstring v7.0.30-0+deb9u1 | mcrypt v7.0.30-0+deb9u1 | mosquitto v0.4.0 | mysqli v7.0.30-0+deb9u1 | mysqlnd vmysqlnd 5.0.12-dev - 20150407 - Id: b5c5906d452ec590732a93b051f3827e02749b83 | openssl v7.0.30-0+deb9u1 | pcre v7.0.30-0+deb9u1 | PDO v7.0.30-0+deb9u1 | pdo_mysql v7.0.30-0+deb9u1 | Phar v2.0.2 | posix v7.0.30-0+deb9u1 | readline v7.0.30-0+deb9u1 | redis v4.1.1 | Reflection v7.0.30-0+deb9u1 | session v7.0.30-0+deb9u1 | shmop v7.0.30-0+deb9u1 | SimpleXML v7.0.30-0+deb9u1 | sockets v7.0.30-0+deb9u1 | SPL v7.0.30-0+deb9u1 | standard v7.0.30-0+deb9u1 | sysvmsg v7.0.30-0+deb9u1 | sysvsem v7.0.30-0+deb9u1 | sysvshm v7.0.30-0+deb9u1 | tokenizer v7.0.30-0+deb9u1 | wddx v7.0.30-0+deb9u1 | xml v7.0.30-0+deb9u1 | xmlreader v7.0.30-0+deb9u1 | xmlwriter v7.0.30-0+deb9u1 | xsl v7.0.30-0+deb9u1 | Zend OPcache v7.0.30-0+deb9u1 | zlib v7.0.30-0+deb9u1
Model :- Raspberry Pi 3 Model B+ Rev 1.3 - 1 GB (Sony UK)SoC :- Broadcom BCM2835Serial num. :- 5ABE4EF9Temperature :- 47.77°C - 48.3°CemonpiRelease :- emonSD-30Oct18File-system :- read-write
Client Information
Browser :- Mozilla/5.0 (Macintosh; Intel Mac OS X 10_14_4) AppleWebKit/605.1.15 (KHTML, like Gecko) Version/12.1 Safari/605.1.15Language :- en-us
Resolution :- 1680 x 1050
borpin
21 May 2019 13:23
19
Did you clear browser cache or try a private window?
HTH (Hope That Helps)
borpin
21 May 2019 13:27
20
Ah rats. Sorry, this is in the ‘graph’ module that is a separate git repository.
cd /var/www/emoncms/Modules/graph
git pull
git checkout master
git pull