I’m trying to investigate my daily electricity usage, import, export using inbuilt emonCMS graph functions.
With the default view the graphs seem to work correctly, reporting values for each feed at each interval, and in the stats view I can see the sum watts for each feed.
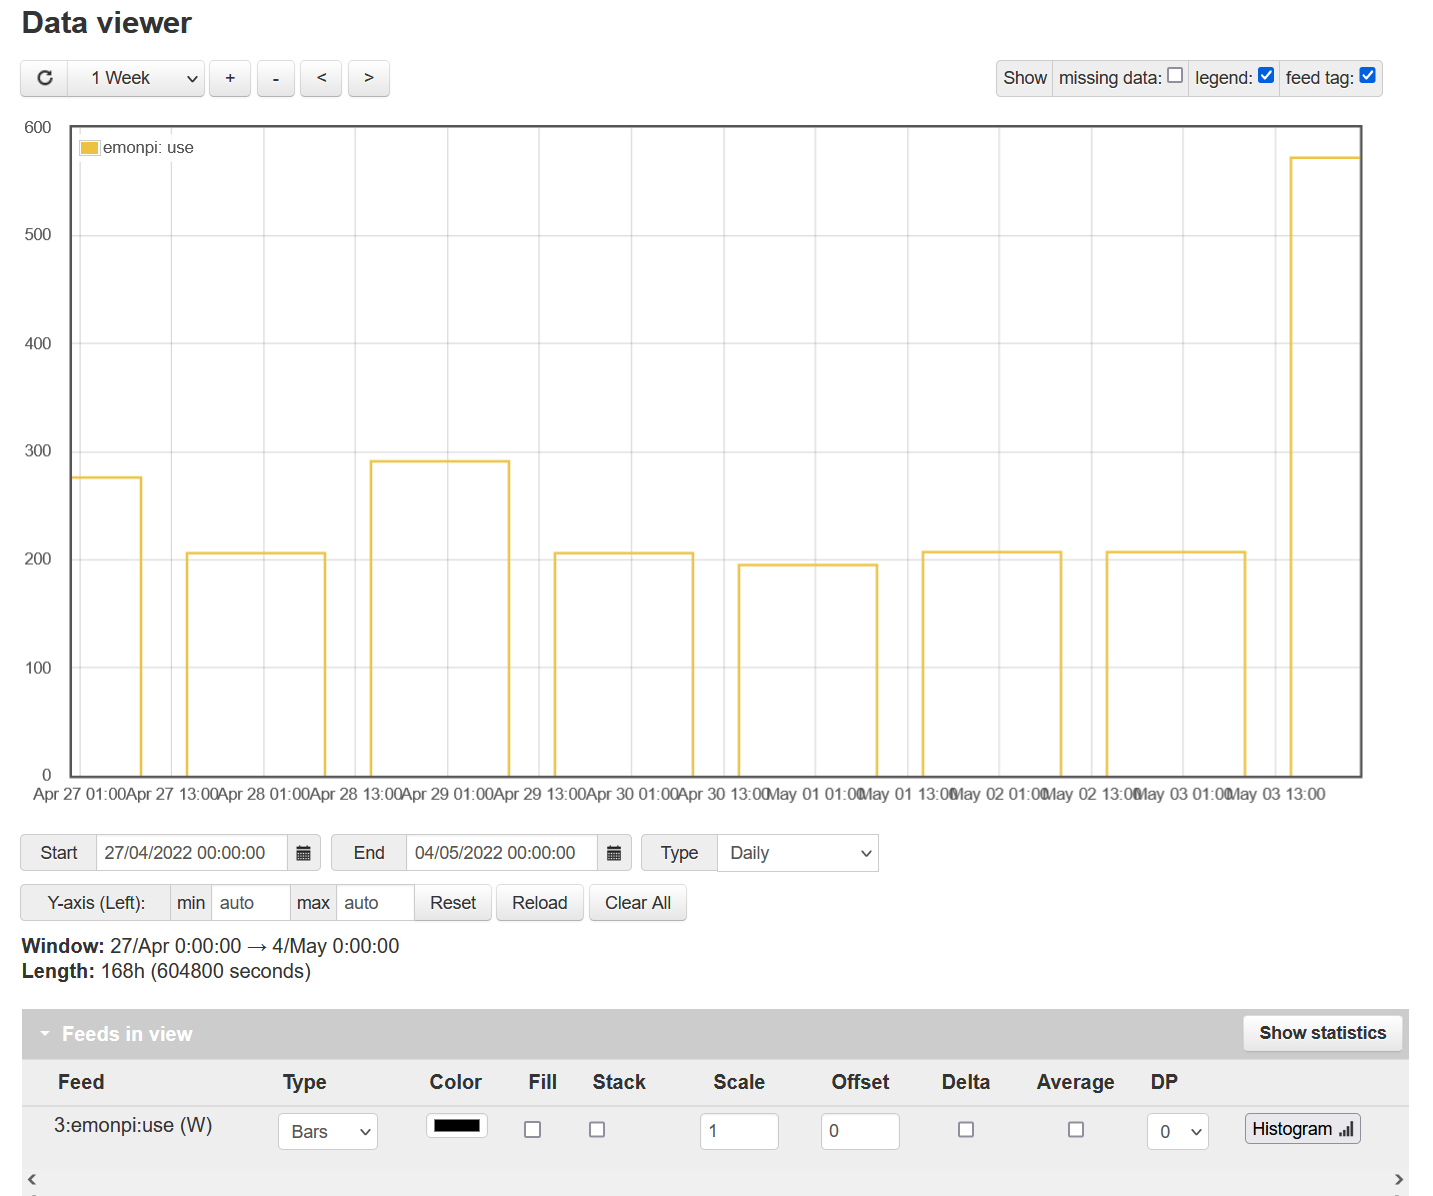
However, when i change the graph ‘type’ to a different interval period, e.g. daily, it doesn’t sum all the values within that period. It looks like it is reporting the first value of the period for the whole period.
For example:
Yes, that is what it does. It’s not really possible to sum up “Watts”, as that is an instantaneous measure of power at a single moment rather than energy consumed over time. There is an Average option next to the feed, but I’ve never managed to get it to work.
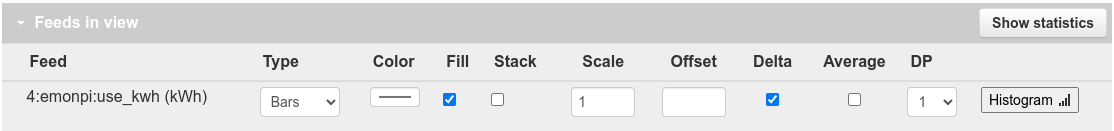
You’d be better off graphing the use_kwh feed instead, selecting the ‘daily’ interval and ticking the Delta option for the feed. Then you’ll get the amount of kWh used per day.