Hi All,
I’ve continued tinkering with the graph module and wanted community feedback about how to take a few items forward. For some history of previous updates see Date Time Picker for Graphs
And as part of my pull request discussion, I’m looking to add the option to show/ hide the numeric separators for the tooltip and potentially the CSV output as well.
Should the option be given to set the separator for each feed? Or for the entire graph?
My suggested approach is for each feed, then the user has ultimate control and in case you want to have a mix for different feeds.
As adding fields is starting to make the feeds table a little cluttered I’m also thinking of giving an option for “standard” fields versus “extended”. I’ve made a mock up below and would like community thoughts before writing the code to support this.
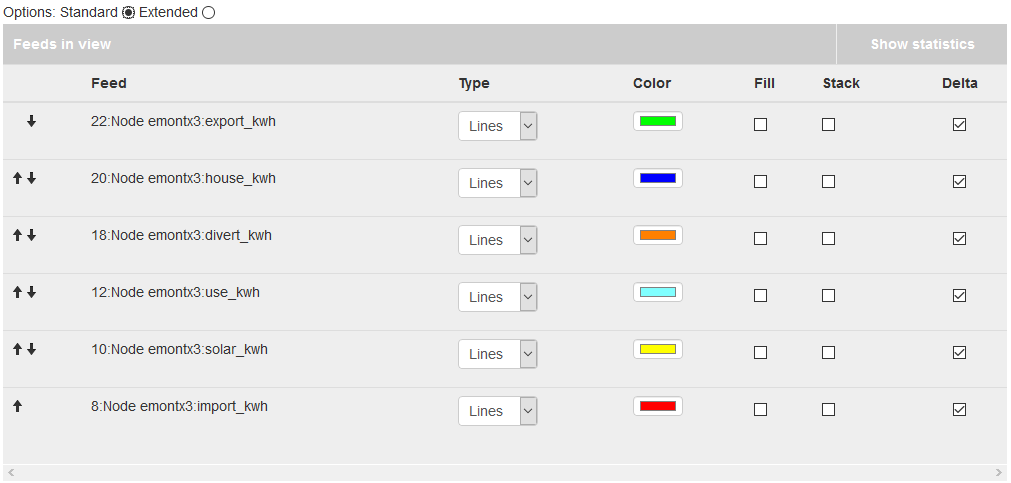
Standard mode:
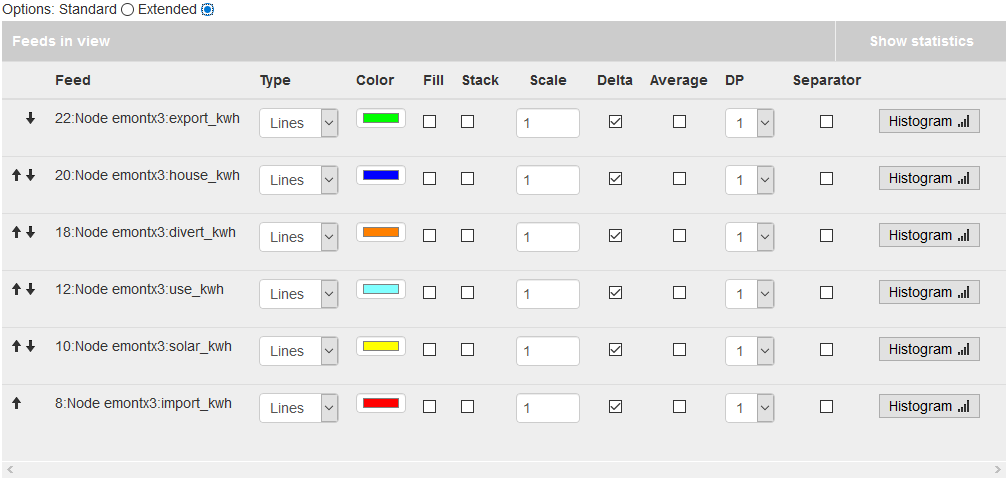
Extended mode (including separator option):
And should any of the fields be switched between views?
I will also look into placing the settings within the table header to hopefully make it more visible