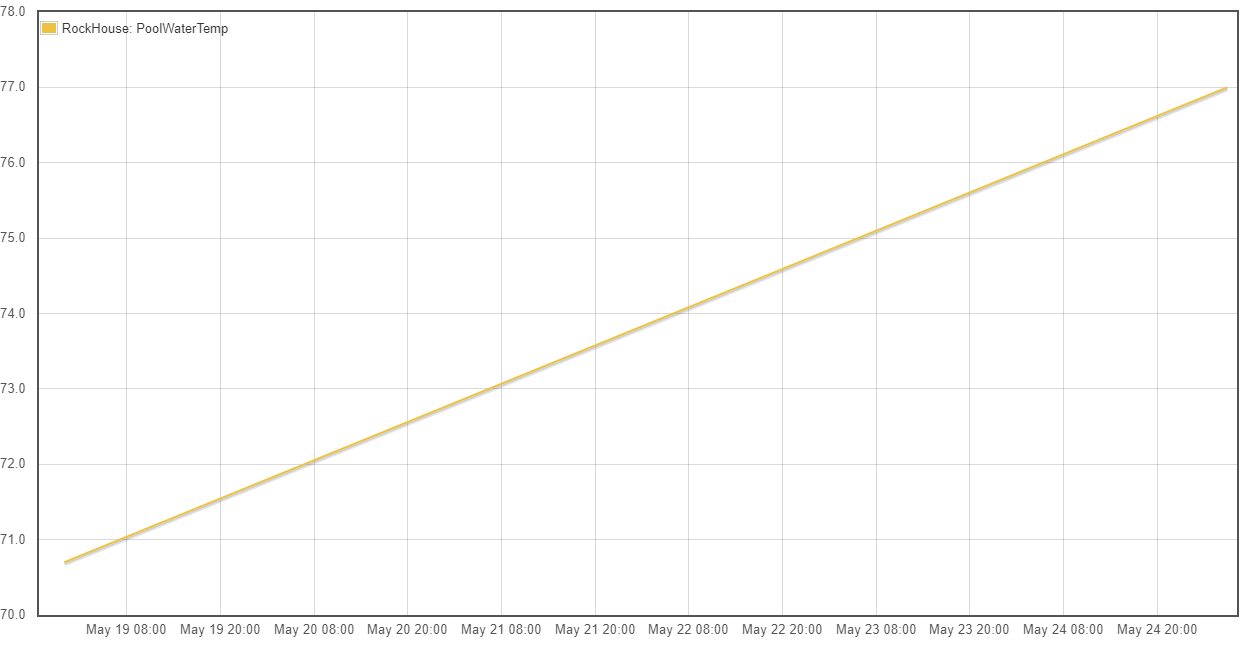
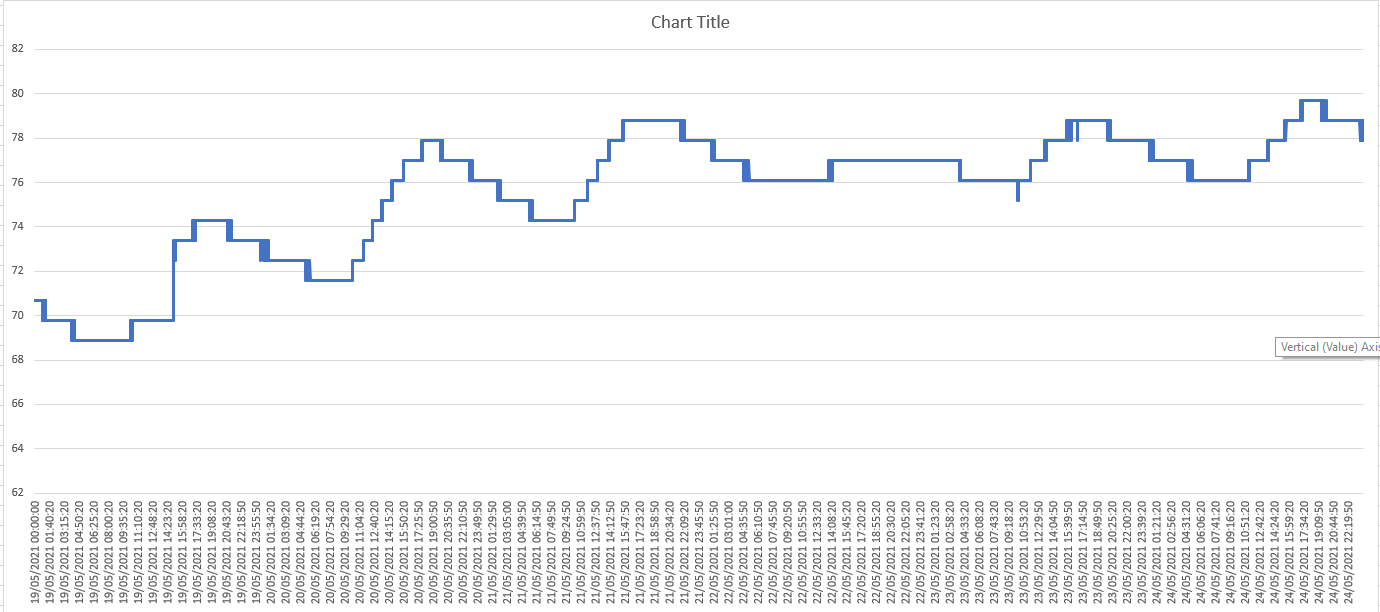
I have a graph that doesn’t show all of my data, but if I export the data to excel it shows everything, or if I zoom in it shows the other data points. Is there a setting I’m missing?
Hello @rocksolidsr this usually happens if the feed is created with a higher resolution than you post data to it. When you create a feed you can set the interval, this should match the rate that you are posting data.
A quick way to see the data that is in your existing feed is to put a tick in the ‘Average’ checkbox below the graph in the graph module:
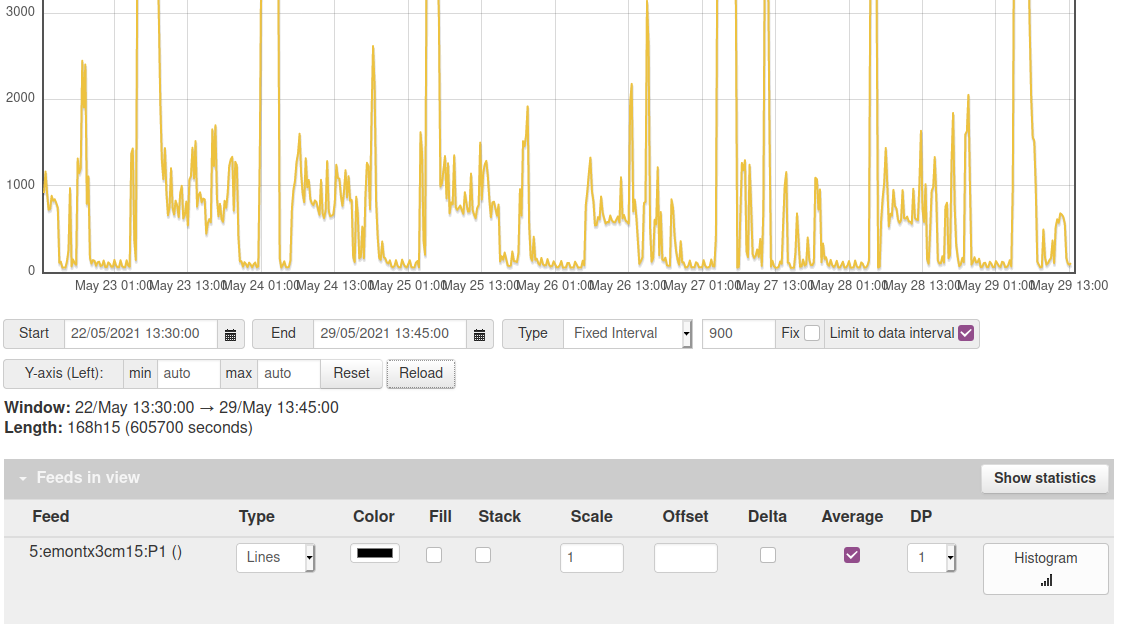
thank you that seemed to fix it