not sure if I found the reason but today I fiddled some more
The feeds coming via the victron pi was sending data every 30 seconds (+/-)
emoncms online expected date every 10s I think though you can’t change it once set … anyway
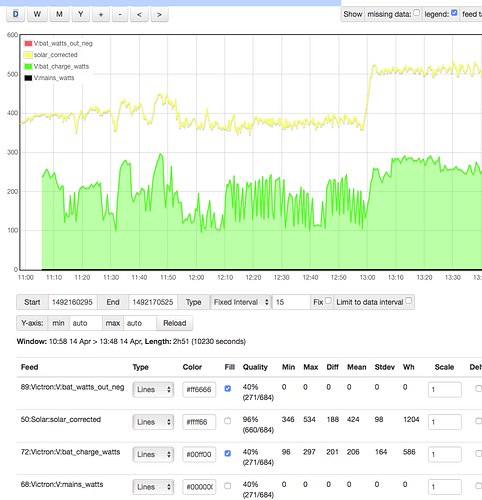
I pushed my victronpi to push every 20 seconds since noon and the graphs started to show some but
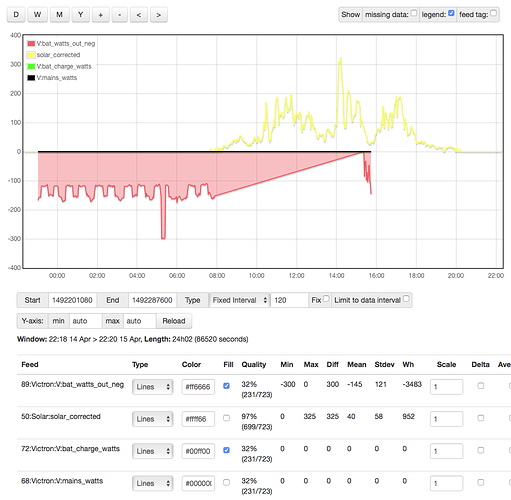
I remade the graph and it still shows gaps when I stay on let’s say day level (remember I fiddles after lunch)
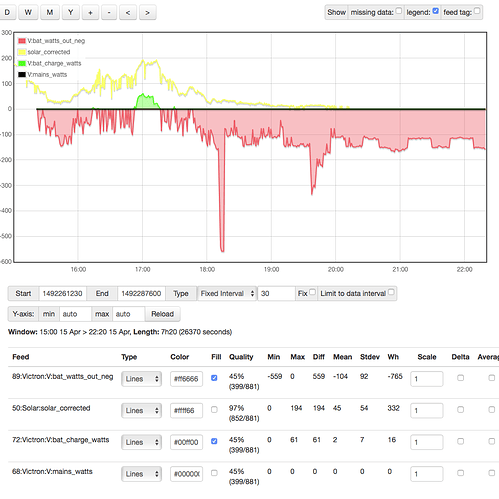
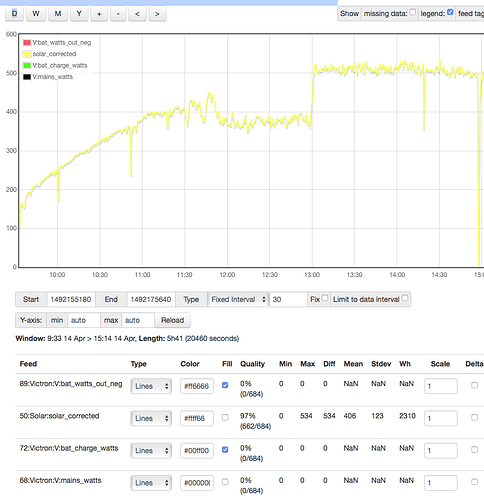
But when I zoom in then suddenly when I leave out the gap period the graph plots (see images)
I have no clue if related
PS : just did the same on another day with gaps, once I zoom in the graph plots correct …


