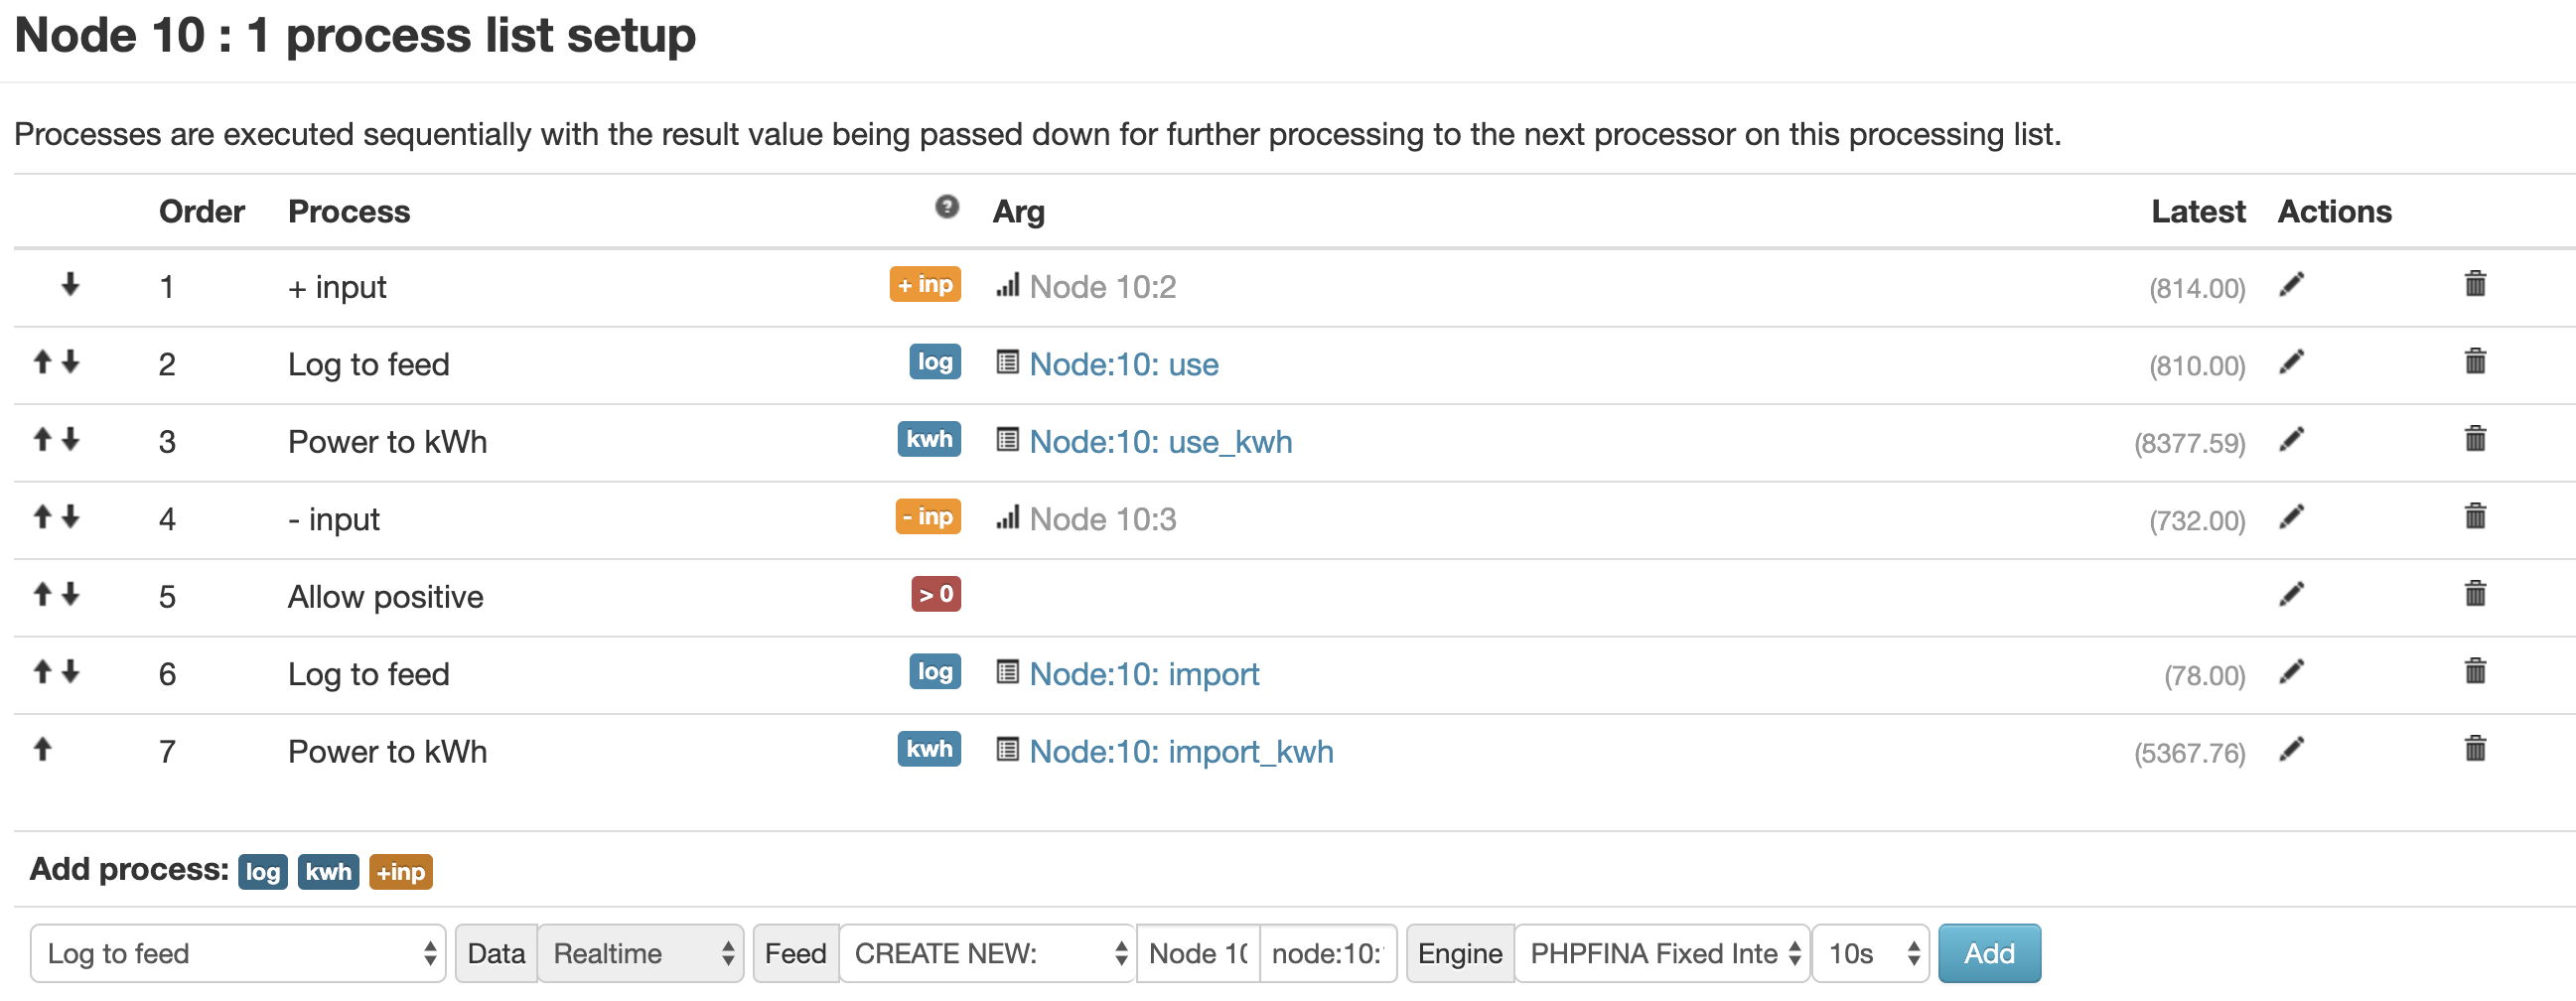
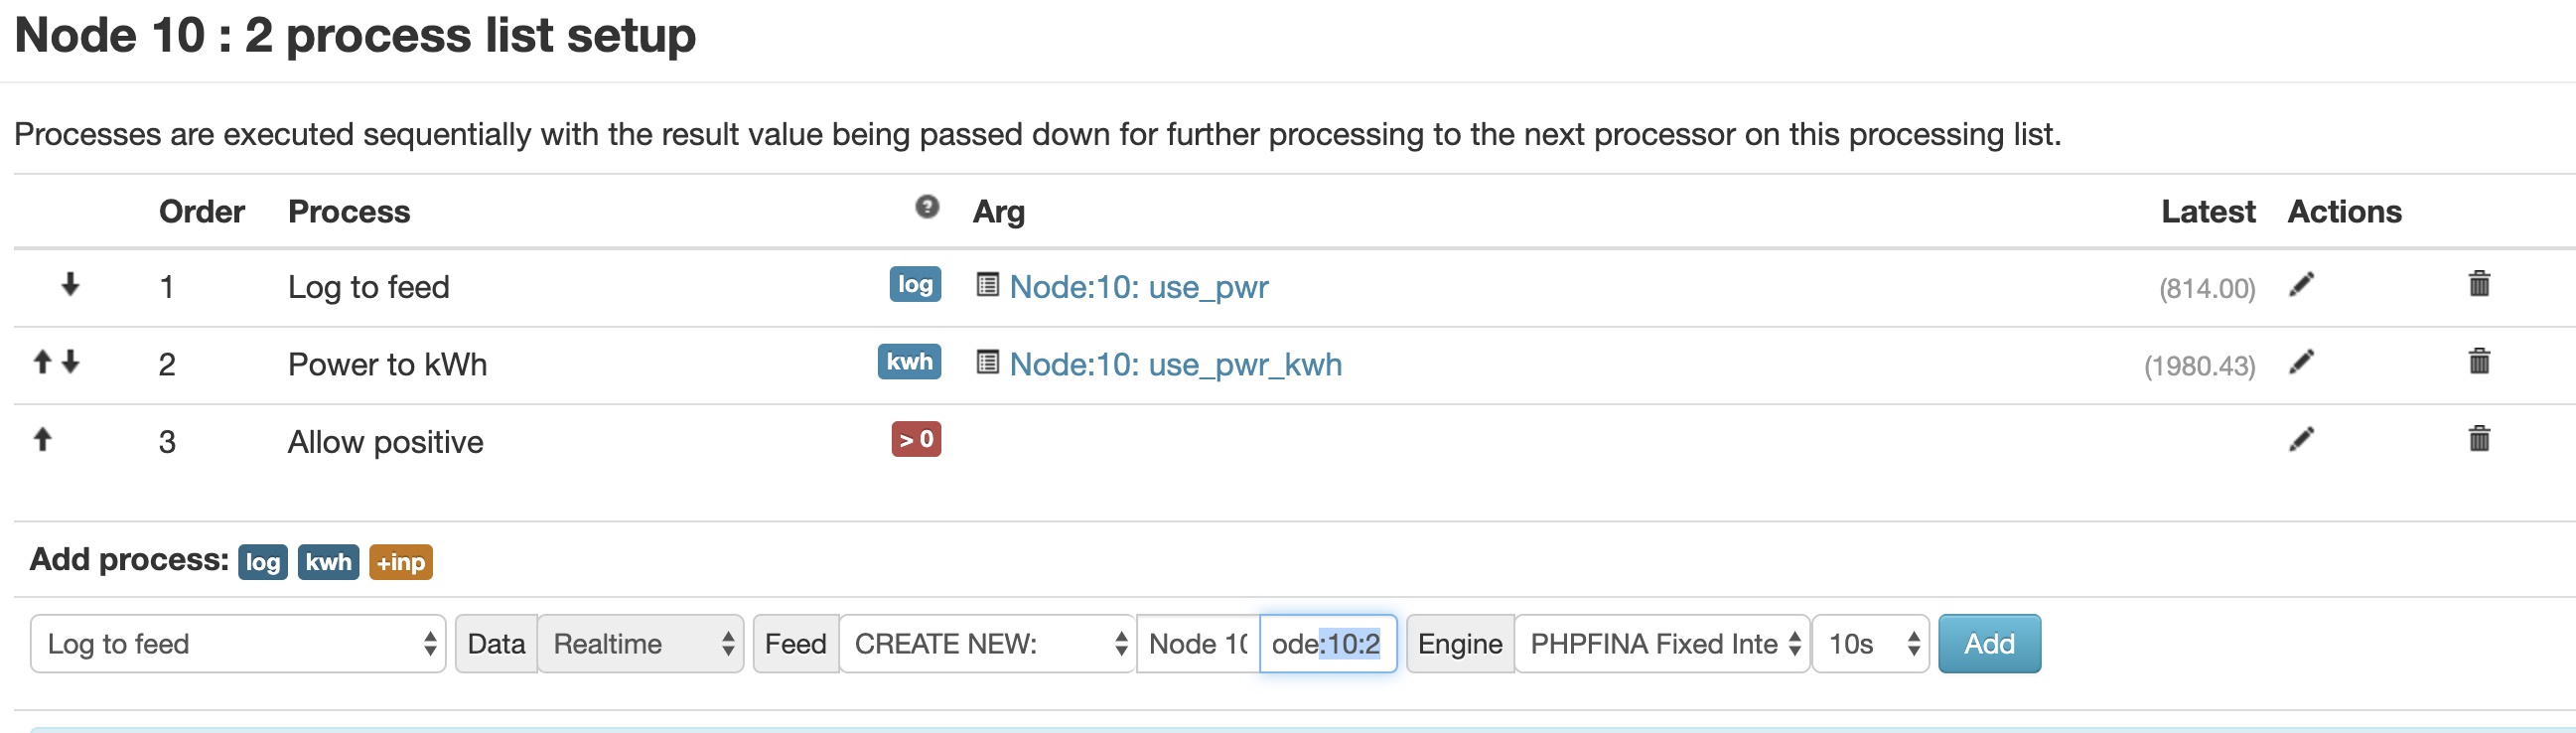
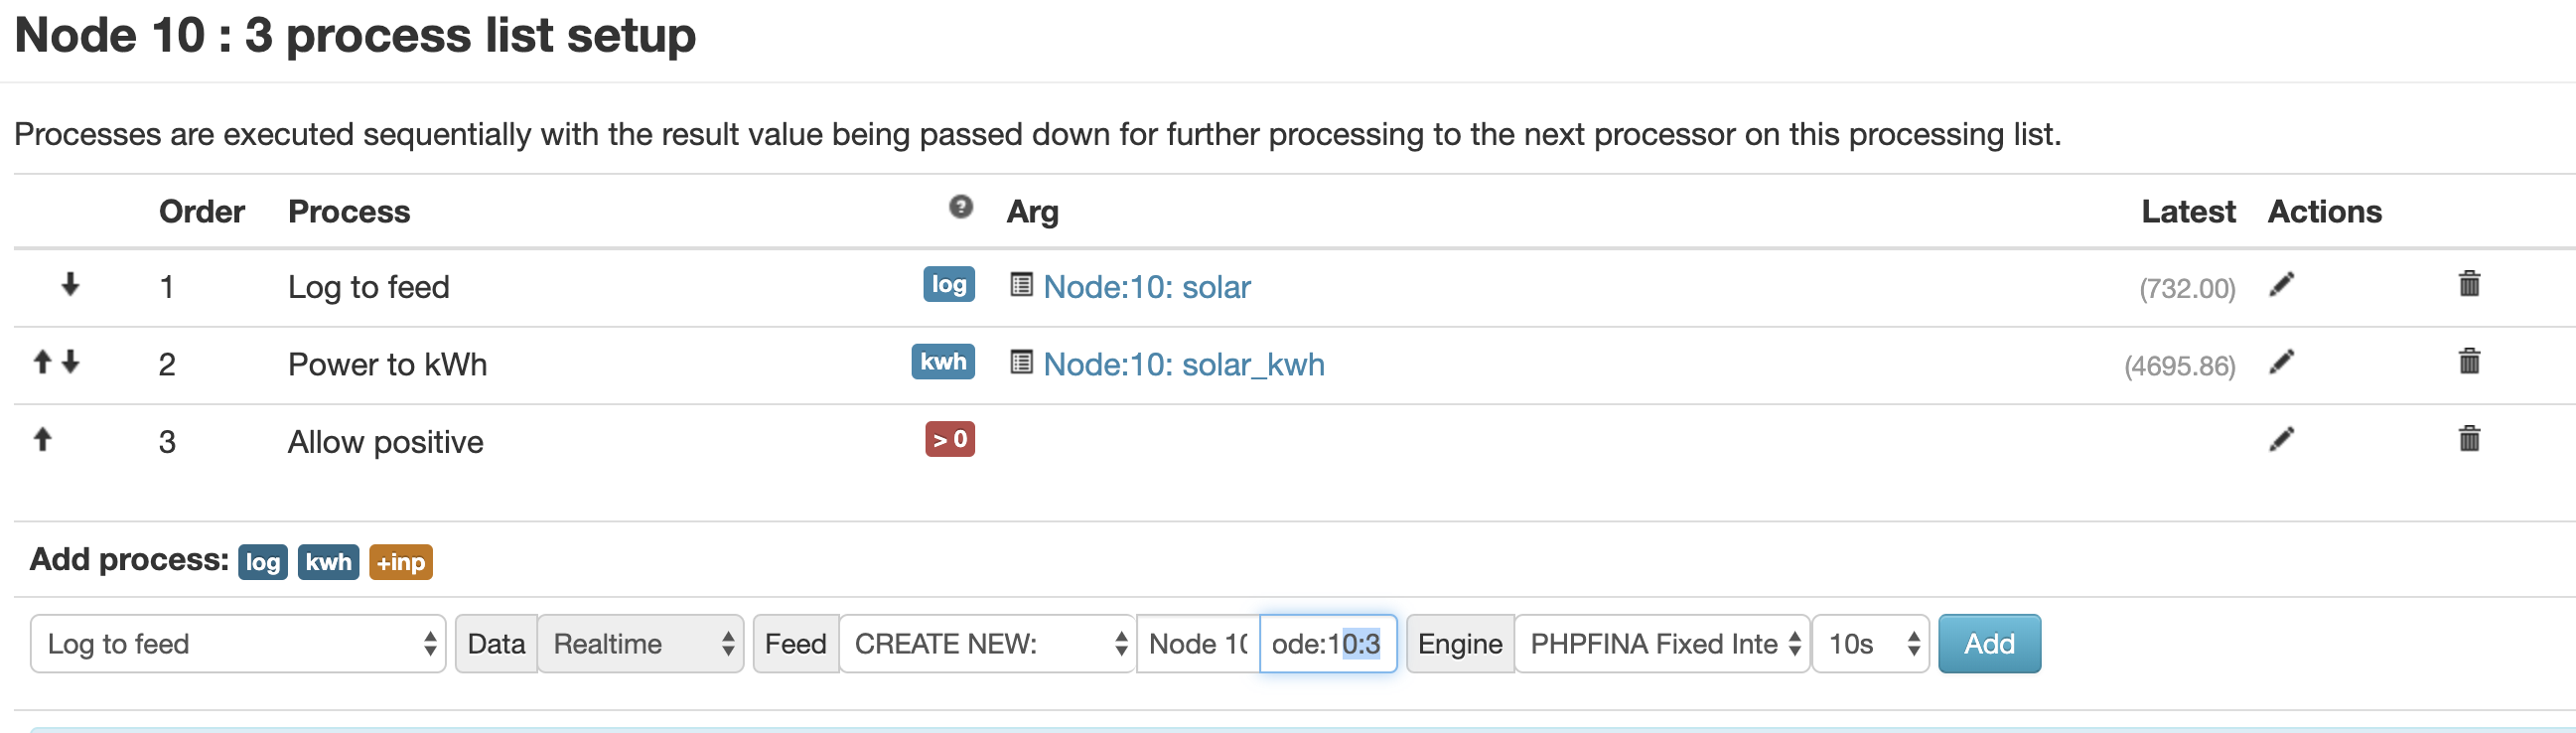
It does look ok, I suspect those 3 inactive feeds are redundant early experiments or something similar. Those 3 feed names do not appear in any of your processlist and all the feeds that are in the processlist are showing as updating ok in the feed list.
Also if you look at the feed file sizes the inactive feeds are very small, plus all the acrive feeds id numbers are consecutive as if they were set up all on one go, seperate to the inactive feeds.
I would hazard a guess and say the inactive feeds could possibly be deleted but unless you are confident that is the case, maybe leave them be until you are sure.
Hmm OK, i’ll have to go back to the manual, I cant seem to visualize any of the data even thought the input and feed values are changing, thought this was related to the 3 inactive feeds…
If I go to the data viewer for any of the other updating feeds it shows no data. Statistics in the “feeds in View” shows 0% quality.
Set all this up 6 years ago so struggling to remember everything.
Some progress but I think I will delete everything and start again.
Using the Visualization menu item I can see data now on the feeds, but not when using the Data viewer from the feed list.
Had my CT’s in the wrong order and after some swapping and resetting the feeds in the My Solar app I can now see the values in the App. weirdly the App graph display only works from the time I open and are viewing, no historical values, like the graph is only showing real time values while I’m looking then loses the data as soon as I close the view. Think I have remember enough now to wipe and start again.
Thanks for your help!!